
Seller's Agent in 2025
Ruben Contreras
Comey & Shepherd
(513) 313-1951
3 in this area
118 Total Sales


Estimated Value: $215,000 - $259,000
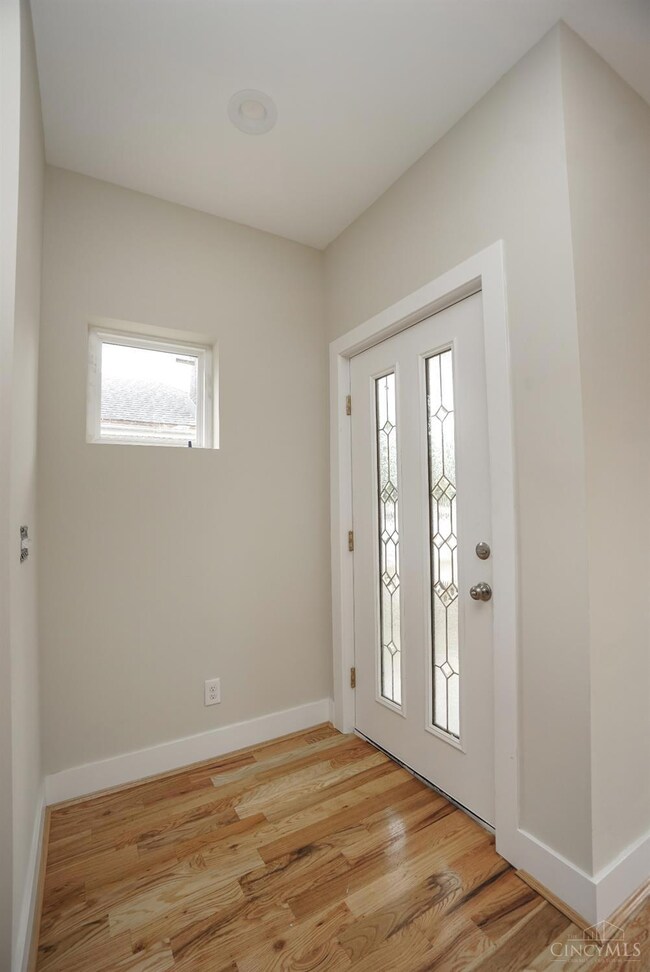
New construction, everything is new, Beautiful large modern kitchen, great hardwood floors, amazing bathrooms and much much more. 1300 sqft. Huge flat yard, Great location near business, shopping & express way.
Last Agent to Sell the Property
Comey & Shepherd License #2010003246 Listed on: 09/25/2025
| Date | Buyer | Sale Price | Title Company |
|---|---|---|---|
| Johnson Reginald | -- | None Listed On Document | |
| Johnson Reginald | $240,000 | American Homeland Title (Ahta) | |
| J & J Houseworks Llc | $30,000 | None Listed On Document | |
| J & J Houseworks Llc | $30,000 | None Listed On Document | |
| Vanguard Real Estate Holdings Llc | $20,000 | None Listed On Document | |
| Neumann Brothers Llc | $10,000 | None Listed On Document | |
| Neumann Brothers Llc | $10,000 | None Listed On Document | |
| Davis Thomas J | $2,000 | Attorney | |
| Mullis David A | -- | None Available | |
| Davis Boyd G | -- | -- | |
| Davis Thomas | -- | -- |
| Date | Status | Borrower | Loan Amount |
|---|---|---|---|
| Previous Owner | Johnson Reginald | $232,800 |
| Date | Event | Price | List to Sale | Price per Sq Ft |
|---|---|---|---|---|
| 11/10/2025 11/10/25 | Sold | $240,000 | 0.0% | $331 / Sq Ft |
| 10/08/2025 10/08/25 | Pending | -- | -- | -- |
| 09/25/2025 09/25/25 | For Sale | $240,000 | -- | $331 / Sq Ft |
| Year | Tax Paid | Tax Assessment Tax Assessment Total Assessment is a certain percentage of the fair market value that is determined by local assessors to be the total taxable value of land and additions on the property. | Land | Improvement |
|---|---|---|---|---|
| 2025 | $1,507 | $21,291 | $5,180 | $16,111 |
| 2024 | $1,034 | $21,291 | $5,180 | $16,111 |
| 2023 | $785 | $21,291 | $5,180 | $16,111 |
| 2022 | $1,648 | $9,534 | $4,872 | $4,662 |
| 2021 | $53 | $9,534 | $4,872 | $4,662 |
| 2020 | $71 | $9,534 | $4,872 | $4,662 |
| 2019 | $15 | $8,082 | $4,130 | $3,952 |
| 2018 | $15 | $8,082 | $4,130 | $3,952 |
| 2017 | $15 | $8,082 | $4,130 | $3,952 |
| 2016 | $516 | $15,264 | $5,453 | $9,811 |
| 2015 | $482 | $15,264 | $5,453 | $9,811 |
| 2014 | $486 | $15,264 | $5,453 | $9,811 |
| 2013 | $546 | $16,069 | $5,740 | $10,329 |
Seller's Agent in 2025
Ruben Contreras
Comey & Shepherd
(513) 313-1951
3 in this area
118 Total Sales
E
Seller Co-Listing Agent in 2025
Eleazar Contreras
Comey & Shepherd
(513) 978-7276
3 in this area
105 Total Sales
Buyer's Agent in 2025
Shani Felder
eXp Realty
(513) 550-8004
1 in this area
10 Total Sales
Source: MLS of Greater Cincinnati (CincyMLS)
MLS Number: 1856383
APN: 590-0071-0248
Disclaimer: Certain information contained herein is derived from information provided by parties other than Homes.com. All information provided is deemed reliable, but is not guaranteed to be accurate and should be independently verified.
![]() The data relating to real estate for sale on this website comes in part from the Broker Reciprocity programs of the MLS of Greater Cincinnati, Inc.. Those listings held by brokerage firms other than Ten-X are marked with the Broker Reciprocity logo and house icon. The properties displayed may not be all of the properties available through Broker Reciprocity.
The data relating to real estate for sale on this website comes in part from the Broker Reciprocity programs of the MLS of Greater Cincinnati, Inc.. Those listings held by brokerage firms other than Ten-X are marked with the Broker Reciprocity logo and house icon. The properties displayed may not be all of the properties available through Broker Reciprocity.
IDX information is provided exclusively for personal, non-commercial use, and may not be used for any purpose other than to identify prospective properties consumers may be interested in purchasing.
Information is deemed reliable but not guaranteed.
Ten-X does not display the entire Cincinnati MLS Broker Reciprocity™ database on this web site. The listings of some real estate brokerage firms have been excluded.
Copyright 2026, MLS of Greater Cincinnati, Inc. All rights reserved
Ask me questions while you tour the home.