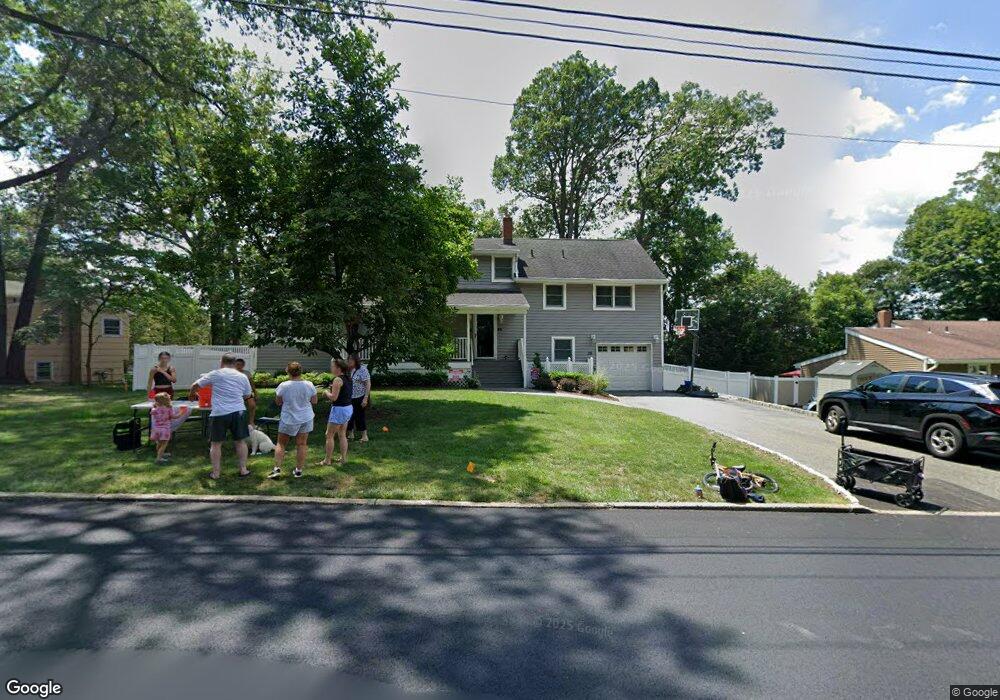
36 Lehigh Way Oakland, NJ 07436
Estimated Value: $723,000 - $876,000
--
Bed
--
Bath
2,170
Sq Ft
$360/Sq Ft
Est. Value
About This Home
This home is located at 36 Lehigh Way, Oakland, NJ 07436 and is currently estimated at $781,502, approximately $360 per square foot. 36 Lehigh Way is a home located in Bergen County with nearby schools including Heights Elementary School, Valley Middle School, and Indian Hills High School.
Ownership History
Date
Name
Owned For
Owner Type
Purchase Details
Closed on
Oct 24, 2008
Sold by
Peet Margaret M
Bought by
Bretthauer Catherine M and Destefano Ralph M
Current Estimated Value
Home Financials for this Owner
Home Financials are based on the most recent Mortgage that was taken out on this home.
Original Mortgage
$376,000
Outstanding Balance
$245,792
Interest Rate
6.08%
Mortgage Type
New Conventional
Estimated Equity
$535,710
Purchase Details
Closed on
Sep 15, 2000
Sold by
Bavagnoli William C
Bought by
Peet Margaret M
Home Financials for this Owner
Home Financials are based on the most recent Mortgage that was taken out on this home.
Original Mortgage
$95,000
Interest Rate
7.94%
Purchase Details
Closed on
Aug 31, 1994
Sold by
Hardman Dolorea
Bought by
Bavagnoli William and Bavagnoli Susan
Home Financials for this Owner
Home Financials are based on the most recent Mortgage that was taken out on this home.
Original Mortgage
$149,000
Interest Rate
8.44%
Create a Home Valuation Report for This Property
The Home Valuation Report is an in-depth analysis detailing your home's value as well as a comparison with similar homes in the area
Home Values in the Area
Average Home Value in this Area
Purchase History
| Date | Buyer | Sale Price | Title Company |
|---|---|---|---|
| Bretthauer Catherine M | $470,000 | -- | |
| Peet Margaret M | $292,000 | -- | |
| Bavagnoli William | $199,000 | -- |
Source: Public Records
Mortgage History
| Date | Status | Borrower | Loan Amount |
|---|---|---|---|
| Open | Bretthauer Catherine M | $376,000 | |
| Previous Owner | Peet Margaret M | $95,000 | |
| Previous Owner | Bavagnoli William | $149,000 |
Source: Public Records
Tax History Compared to Growth
Tax History
| Year | Tax Paid | Tax Assessment Tax Assessment Total Assessment is a certain percentage of the fair market value that is determined by local assessors to be the total taxable value of land and additions on the property. | Land | Improvement |
|---|---|---|---|---|
| 2025 | $13,789 | $647,600 | $331,000 | $316,600 |
| 2024 | $13,620 | $599,500 | $300,300 | $299,200 |
| 2023 | $13,157 | $573,700 | $288,800 | $284,900 |
| 2022 | $13,157 | $559,400 | $282,400 | $277,000 |
| 2021 | $11,994 | $390,700 | $201,500 | $189,200 |
| 2020 | $11,717 | $390,700 | $201,500 | $189,200 |
| 2019 | $11,307 | $390,700 | $201,500 | $189,200 |
| 2018 | $11,069 | $390,700 | $201,500 | $189,200 |
| 2017 | $10,924 | $390,700 | $201,500 | $189,200 |
| 2016 | $10,627 | $390,700 | $201,500 | $189,200 |
| 2015 | $10,416 | $390,700 | $201,500 | $189,200 |
| 2014 | $10,199 | $390,600 | $201,500 | $189,100 |
Source: Public Records
Map
Nearby Homes
- 11 Loyola Place
- 22 Calumet Ave
- 25 Seton Hall Dr
- 29 Thackeray Rd
- 47 Allen Dr
- 102 Hiawatha Blvd
- 163 Hiawatha Blvd
- 509 Ramapo Valley Rd
- 511 Ramapo Valley Rd
- 2 Belmont Place
- 5 Arlington Place
- 22 Arlington Place
- 18 Arlington Place
- 16 Arlington Place
- 20 Arlington Place
- 83 Oneida Ave
- 88 Minnehaha Blvd
- Shaffer Plan at The Ridings at Oakland
- 88 Lakeshore Dr
- 7 Arlington Place
- 32 Lehigh Way
- 37 Lehigh Way
- 33 Lehigh Way
- 28 Lehigh Way
- 12 Loyola Place
- 29 Lehigh Way
- 20 Loyola Place
- 23 Loyola Place
- 24 Lehigh Way
- 4 Loyola Place
- 23 Lehigh Way
- 15 Princeton Terrace
- 9 Princeton Terrace
- 24 Loyola Place
- 65 Loyola Place
- 17 Princeton Terrace
- 27 Loyola Place
- 20 Lehigh Way
- 7 Princeton Terrace
- 19 Princeton Terrace