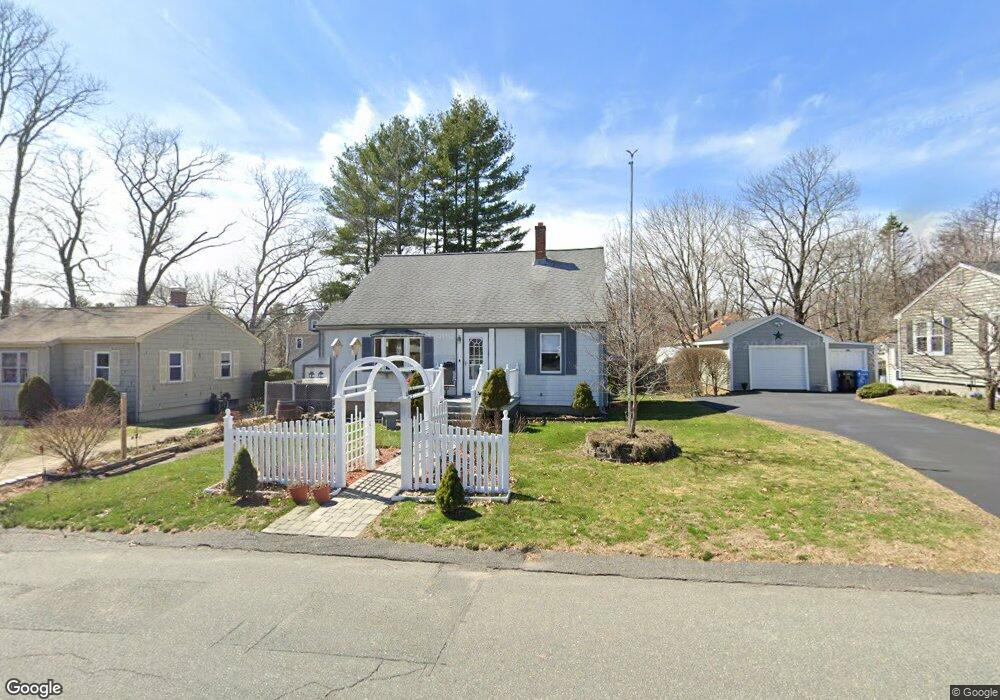
36 Loring Ave Whitman, MA 02382
Estimated Value: $497,000 - $568,000
4
Beds
2
Baths
1,344
Sq Ft
$399/Sq Ft
Est. Value
About This Home
This home is located at 36 Loring Ave, Whitman, MA 02382 and is currently estimated at $535,805, approximately $398 per square foot. 36 Loring Ave is a home located in Plymouth County with nearby schools including Trinity Catholic Academy and Cardinal Spellman High School.
Ownership History
Date
Name
Owned For
Owner Type
Purchase Details
Closed on
Aug 21, 2023
Sold by
36 Loring Ave Rt and Sharon
Bought by
Sharon Ft and Lafratta
Current Estimated Value
Purchase Details
Closed on
Jan 21, 2015
Sold by
Sharon Edward N and Sharon Karen A
Bought by
36 Loring Avenue Rt and Sharon
Purchase Details
Closed on
Dec 19, 1977
Bought by
36 Loring Ave Rt
Create a Home Valuation Report for This Property
The Home Valuation Report is an in-depth analysis detailing your home's value as well as a comparison with similar homes in the area
Home Values in the Area
Average Home Value in this Area
Purchase History
| Date | Buyer | Sale Price | Title Company |
|---|---|---|---|
| Sharon Ft | -- | None Available | |
| Sharon Ft | -- | None Available | |
| 36 Loring Avenue Rt | -- | -- | |
| 36 Loring Ave Rt | $28,500 | -- | |
| 36 Loring Avenue Rt | -- | -- |
Source: Public Records
Mortgage History
| Date | Status | Borrower | Loan Amount |
|---|---|---|---|
| Previous Owner | 36 Loring Ave Rt | $150,000 | |
| Previous Owner | 36 Loring Ave Rt | $100,000 |
Source: Public Records
Tax History
| Year | Tax Paid | Tax Assessment Tax Assessment Total Assessment is a certain percentage of the fair market value that is determined by local assessors to be the total taxable value of land and additions on the property. | Land | Improvement |
|---|---|---|---|---|
| 2025 | $5,716 | $435,700 | $199,800 | $235,900 |
| 2024 | $5,297 | $415,800 | $195,900 | $219,900 |
| 2023 | $5,021 | $370,000 | $169,900 | $200,100 |
| 2022 | $4,965 | $341,000 | $154,400 | $186,600 |
| 2021 | $4,594 | $296,400 | $128,400 | $168,000 |
| 2020 | $4,612 | $291,000 | $128,400 | $162,600 |
| 2019 | $4,309 | $280,200 | $128,400 | $151,800 |
| 2018 | $3,979 | $261,100 | $121,600 | $139,500 |
| 2017 | $3,937 | $261,100 | $121,600 | $139,500 |
| 2016 | $3,774 | $242,100 | $120,600 | $121,500 |
| 2015 | $3,489 | $223,500 | $106,200 | $117,300 |
Source: Public Records
Map
Nearby Homes
Your Personal Tour Guide
Ask me questions while you tour the home.