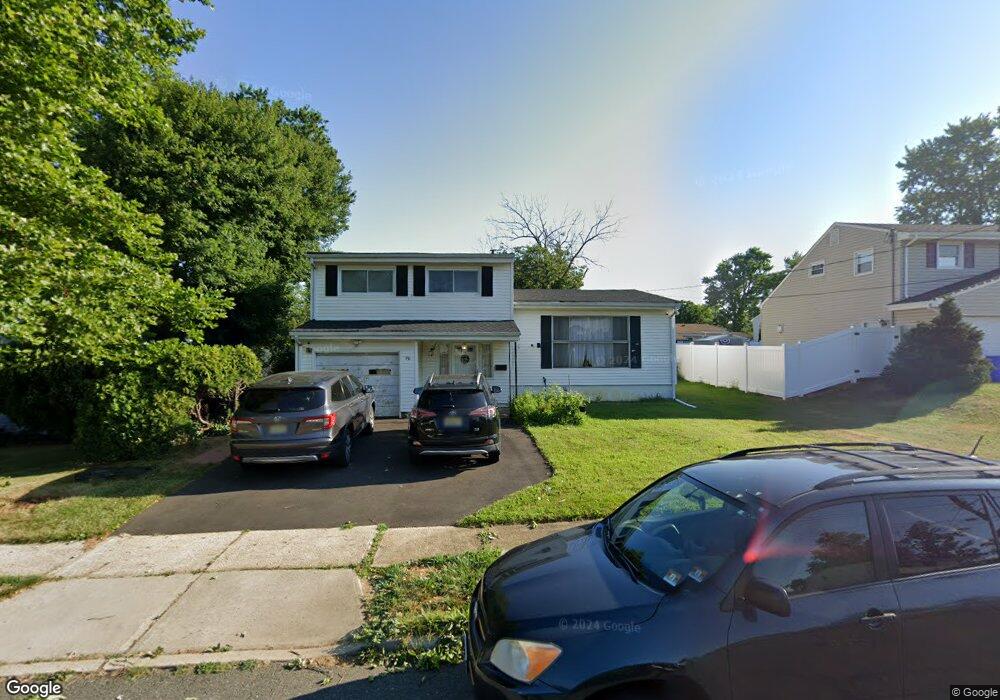
36 Mabaline Rd Old Bridge, NJ 08857
Estimated Value: $541,000 - $609,000
--
Bed
--
Bath
1,529
Sq Ft
$383/Sq Ft
Est. Value
About This Home
This home is located at 36 Mabaline Rd, Old Bridge, NJ 08857 and is currently estimated at $585,440, approximately $382 per square foot. 36 Mabaline Rd is a home located in Middlesex County with nearby schools including Old Bridge High School, St. Ambrose School, and Calvary Christian School.
Ownership History
Date
Name
Owned For
Owner Type
Purchase Details
Closed on
Aug 13, 2001
Sold by
Azmy Mohamed
Bought by
Cantel Gregory and Cantel Liza
Current Estimated Value
Home Financials for this Owner
Home Financials are based on the most recent Mortgage that was taken out on this home.
Original Mortgage
$187,000
Outstanding Balance
$72,471
Interest Rate
7.06%
Estimated Equity
$512,969
Purchase Details
Closed on
Sep 30, 1997
Sold by
Dougherty Anthony
Bought by
Azmy Mohammed and Azmy Eman
Home Financials for this Owner
Home Financials are based on the most recent Mortgage that was taken out on this home.
Original Mortgage
$108,000
Interest Rate
7.19%
Create a Home Valuation Report for This Property
The Home Valuation Report is an in-depth analysis detailing your home's value as well as a comparison with similar homes in the area
Home Values in the Area
Average Home Value in this Area
Purchase History
| Date | Buyer | Sale Price | Title Company |
|---|---|---|---|
| Cantel Gregory | $209,000 | -- | |
| Azmy Mohammed | $142,000 | -- |
Source: Public Records
Mortgage History
| Date | Status | Borrower | Loan Amount |
|---|---|---|---|
| Open | Cantel Gregory | $187,000 | |
| Previous Owner | Azmy Mohammed | $108,000 |
Source: Public Records
Tax History Compared to Growth
Tax History
| Year | Tax Paid | Tax Assessment Tax Assessment Total Assessment is a certain percentage of the fair market value that is determined by local assessors to be the total taxable value of land and additions on the property. | Land | Improvement |
|---|---|---|---|---|
| 2025 | $8,487 | $150,300 | $69,000 | $81,300 |
| 2024 | $8,142 | $150,300 | $69,000 | $81,300 |
| 2023 | $8,142 | $150,300 | $69,000 | $81,300 |
| 2022 | $7,955 | $150,300 | $69,000 | $81,300 |
| 2021 | $5,839 | $150,300 | $69,000 | $81,300 |
| 2020 | $7,721 | $150,300 | $69,000 | $81,300 |
| 2019 | $7,590 | $150,300 | $69,000 | $81,300 |
| 2018 | $7,506 | $150,300 | $69,000 | $81,300 |
| 2017 | $7,263 | $150,300 | $69,000 | $81,300 |
| 2016 | $7,112 | $150,300 | $69,000 | $81,300 |
| 2015 | $6,989 | $150,300 | $69,000 | $81,300 |
| 2014 | $6,918 | $150,300 | $69,000 | $81,300 |
Source: Public Records
Map
Nearby Homes