P
Seller's Agent in 2025
Petro Papi
TopHills Realty Partners, LLC
(508) 579-8049
1 in this area
3 Total Sales
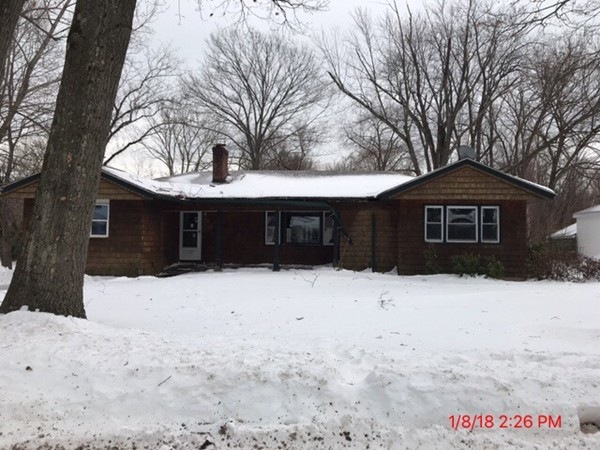
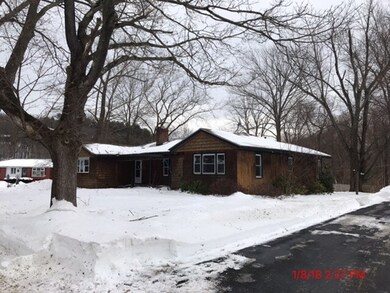
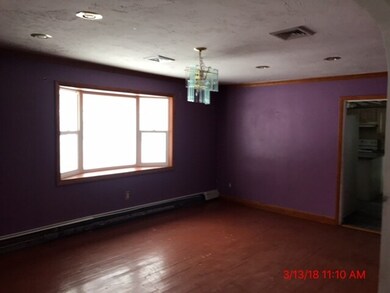
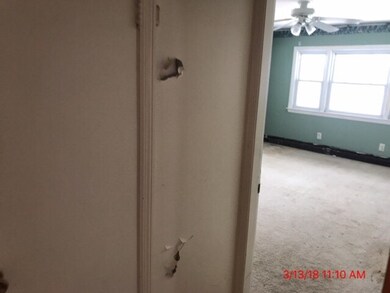
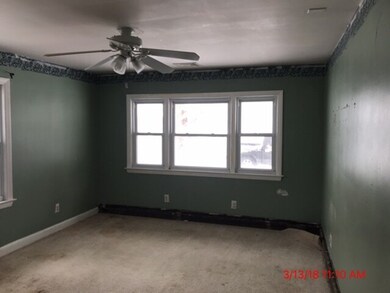
Lovely ranch with 3 bedrooms, 2 1/2 bathrooms. Large square footage. Bring your updates to restore this lovely home. Great West Side location between Salisbury Street and Highland/Pleasant. I-290 and I-190 are right nearby.
| Date | Type | Sale Price | Title Company |
|---|---|---|---|
| Not Resolvable | $177,000 | -- | |
| Deed In Lieu Of Foreclosure | $203,522 | -- | |
| Foreclosure Deed | $212,500 | -- | |
| Deed | $300,000 | -- | |
| Deed | $185,000 | -- | |
| Deed | $185,000 | -- | |
| Deed | $122,500 | -- |
| Date | Status | Loan Amount | Loan Type |
|---|---|---|---|
| Previous Owner | $211,738 | FHA | |
| Previous Owner | $212,354 | FHA | |
| Previous Owner | $209,216 | Purchase Money Mortgage |
| Date | Event | Price | Change | Sq Ft Price |
|---|---|---|---|---|
| 02/25/2025 02/25/25 | Rented | $3,000 | 0.0% | -- |
| 02/24/2025 02/24/25 | Under Contract | -- | -- | -- |
| 02/19/2025 02/19/25 | For Rent | $3,000 | +20.0% | -- |
| 02/03/2019 02/03/19 | Rented | $2,500 | 0.0% | -- |
| 02/03/2019 02/03/19 | Under Contract | -- | -- | -- |
| 01/09/2019 01/09/19 | For Rent | $2,500 | 0.0% | -- |
| 03/29/2018 03/29/18 | Sold | $177,000 | +1.1% | $84 / Sq Ft |
| 02/01/2018 02/01/18 | Pending | -- | -- | -- |
| 01/10/2018 01/10/18 | For Sale | $175,000 | -- | $83 / Sq Ft |
| Year | Tax Paid | Tax Assessment Tax Assessment Total Assessment is a certain percentage of the fair market value that is determined by local assessors to be the total taxable value of land and additions on the property. | Land | Improvement |
|---|---|---|---|---|
| 2025 | $6,673 | $505,900 | $118,700 | $387,200 |
| 2024 | $6,485 | $471,600 | $118,700 | $352,900 |
| 2023 | $6,323 | $440,900 | $103,200 | $337,700 |
| 2022 | $5,640 | $370,800 | $82,600 | $288,200 |
| 2021 | $5,929 | $364,200 | $66,100 | $298,100 |
| 2020 | $5,331 | $313,600 | $66,100 | $247,500 |
| 2019 | $5,002 | $277,900 | $59,500 | $218,400 |
| 2018 | $4,796 | $253,600 | $59,500 | $194,100 |
| 2017 | $4,884 | $254,100 | $59,500 | $194,600 |
| 2016 | $4,887 | $237,100 | $43,800 | $193,300 |
| 2015 | $4,759 | $237,100 | $43,800 | $193,300 |
| 2014 | $4,703 | $240,700 | $43,800 | $196,900 |
P
Seller's Agent in 2025
Petro Papi
TopHills Realty Partners, LLC
(508) 579-8049
1 in this area
3 Total Sales
J
Buyer's Agent in 2025
Julia Therrien
Re/Max Vision
E
Seller's Agent in 2019
Elaine Evans Group
RE/MAX
(508) 954-9019
2 in this area
160 Total Sales

Seller Co-Listing Agent in 2019
Elaine Evans
RE/MAX
(508) 954-9019
42 Total Sales
Seller's Agent in 2018
Michael Madulka
Quinsigamond Realty
(508) 579-7777
75 Total Sales
Source: MLS Property Information Network (MLS PIN)
MLS Number: 72269307
APN: WORC-000043-000009-000033
Disclaimer: Certain information contained herein is derived from information provided by parties other than Homes.com. All information provided is deemed reliable, but is not guaranteed to be accurate and should be independently verified.
![]() The property listing data and information, or the Images, set forth herein were provided to MLS Property Information Network, Inc. from third party sources, including sellers, lessors and public records, and were compiled by MLS Property Information Network, Inc. The property listing data and information, and the Images, are for the personal, non-commercial use of consumers having a good faith interest in purchasing or leasing listed properties of the type displayed to them and may not be used for any purpose other than to identify prospective properties which such consumers may have a good faith interest in purchasing or leasing. MLS Property Information Network, Inc. and its subscribers disclaim any and all representations and warranties as to the accuracy of the property listing data and information, or as to the accuracy of any of the Images, set forth herein.
The property listing data and information, or the Images, set forth herein were provided to MLS Property Information Network, Inc. from third party sources, including sellers, lessors and public records, and were compiled by MLS Property Information Network, Inc. The property listing data and information, and the Images, are for the personal, non-commercial use of consumers having a good faith interest in purchasing or leasing listed properties of the type displayed to them and may not be used for any purpose other than to identify prospective properties which such consumers may have a good faith interest in purchasing or leasing. MLS Property Information Network, Inc. and its subscribers disclaim any and all representations and warranties as to the accuracy of the property listing data and information, or as to the accuracy of any of the Images, set forth herein.