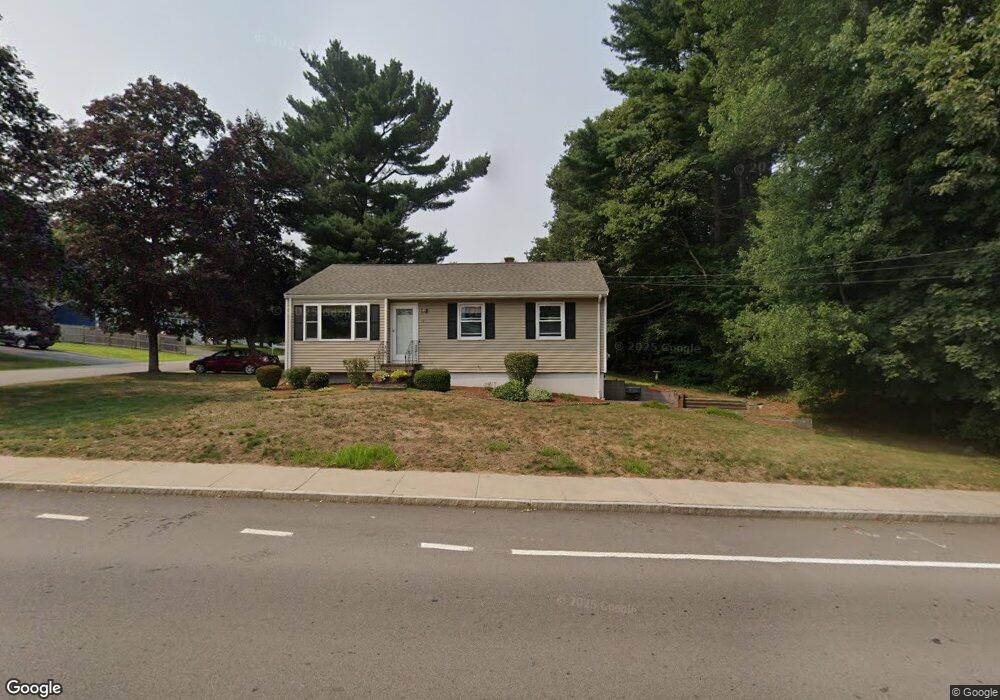
36 Main St Medway, MA 02053
Estimated Value: $537,000 - $563,308
3
Beds
1
Bath
1,032
Sq Ft
$530/Sq Ft
Est. Value
About This Home
This home is located at 36 Main St, Medway, MA 02053 and is currently estimated at $546,827, approximately $529 per square foot. 36 Main St is a home located in Norfolk County with nearby schools including John D. McGovern Elementary School, Burke-Memorial Elementary, and Medway Middle School.
Ownership History
Date
Name
Owned For
Owner Type
Purchase Details
Closed on
Jul 10, 1991
Sold by
Thurston William C and Thurston Patricia
Bought by
Salvatore Mary E
Current Estimated Value
Home Financials for this Owner
Home Financials are based on the most recent Mortgage that was taken out on this home.
Original Mortgage
$97,000
Interest Rate
9.35%
Mortgage Type
Purchase Money Mortgage
Create a Home Valuation Report for This Property
The Home Valuation Report is an in-depth analysis detailing your home's value as well as a comparison with similar homes in the area
Home Values in the Area
Average Home Value in this Area
Purchase History
| Date | Buyer | Sale Price | Title Company |
|---|---|---|---|
| Salvatore Mary E | $127,000 | -- |
Source: Public Records
Mortgage History
| Date | Status | Borrower | Loan Amount |
|---|---|---|---|
| Open | Salvatore Mary E | $88,895 | |
| Closed | Salvatore Mary E | $95,000 | |
| Closed | Salvatore Mary E | $95,000 | |
| Closed | Salvatore Mary E | $97,000 |
Source: Public Records
Tax History Compared to Growth
Tax History
| Year | Tax Paid | Tax Assessment Tax Assessment Total Assessment is a certain percentage of the fair market value that is determined by local assessors to be the total taxable value of land and additions on the property. | Land | Improvement |
|---|---|---|---|---|
| 2025 | $5,865 | $411,600 | $254,400 | $157,200 |
| 2024 | $5,927 | $411,600 | $254,400 | $157,200 |
| 2023 | $5,636 | $353,600 | $222,100 | $131,500 |
| 2022 | $5,331 | $314,900 | $187,800 | $127,100 |
| 2021 | $5,004 | $286,600 | $169,600 | $117,000 |
| 2020 | $4,662 | $266,400 | $149,400 | $117,000 |
| 2019 | $4,343 | $255,900 | $141,300 | $114,600 |
| 2018 | $4,162 | $235,700 | $121,100 | $114,600 |
| 2017 | $4,123 | $230,100 | $121,100 | $109,000 |
| 2016 | $3,774 | $208,400 | $100,900 | $107,500 |
| 2015 | $3,809 | $208,800 | $100,900 | $107,900 |
| 2014 | $3,819 | $202,700 | $110,200 | $92,500 |
Source: Public Records
Map
Nearby Homes
- 50 Main St
- 3 Meryl St
- 106 Holliston St
- 12 Lovering St
- 22 Sunset Dr
- 36 Lovering St
- 20 Broad St Unit 6
- 20 Broad St Unit A
- 20 Broad St Unit 4
- 1 Walnut Ln
- 14 Heritage Dr
- 9 Sanford St
- 14 Sanford St Unit 15
- 30 Broken Tree Rd
- 16 Lexington Ln
- 280 Village St Unit D2
- 19 Sycamore Way Unit L40
- 4 Shaw St
- 2 Spencer St
- 841 Lincoln St
- 2 Lee Ln
- 1B Thunder Hill Rd Unit B
- 1B Thunder Hill Rd
- 38 Main St
- 1 Thunder Hill Rd Unit B
- 1 Thunder Hill Rd Unit A
- 1-B Thunder Hill Rd Unit B
- 1-B Thunder Hill Rd
- 1 Lee Ln
- 4 Lee Ln
- 40 Main St
- 6 Lee Ln
- 26 Karen Ave
- 4 Thunder Hill Rd Unit B
- 4 Thunder Hill Rd Unit A
- 31 Main St
- 25 Karen Ave
- 39 Main St
- 39 Main St
- 39 Main St Unit 39