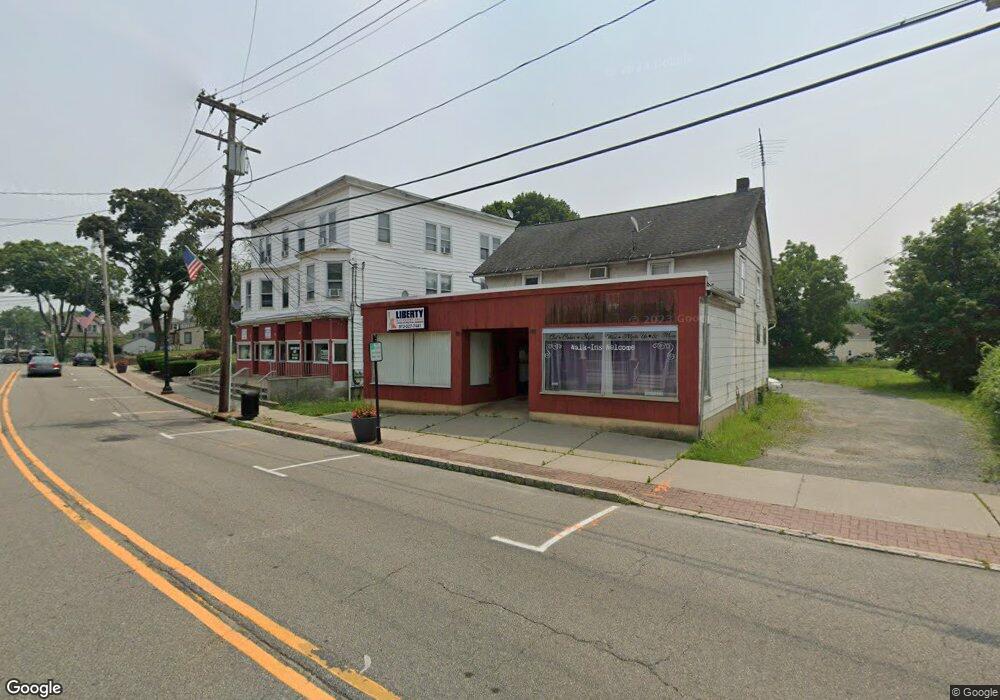
36 Main St Netcong, NJ 07857
Estimated Value: $376,853
Studio
--
Bath
2,083
Sq Ft
$181/Sq Ft
Est. Value
About This Home
This home is located at 36 Main St, Netcong, NJ 07857 and is currently estimated at $376,853, approximately $180 per square foot. 36 Main St is a home located in Morris County with nearby schools including Netcong Elementary School, Lenape Val Regional High School, and Elite Preparatory Academy.
Ownership History
Date
Name
Owned For
Owner Type
Purchase Details
Closed on
Feb 7, 2025
Sold by
Dn Realty Llc
Bought by
Rsb Netcong Llc
Current Estimated Value
Purchase Details
Closed on
Jun 2, 2020
Sold by
Mcelroy Robert H
Bought by
Dn Realty Llc
Purchase Details
Closed on
Jul 24, 2019
Sold by
Mcelroy Repp Barbara M and Mcelroy Robert H
Bought by
Mcelroy Robert H
Create a Home Valuation Report for This Property
The Home Valuation Report is an in-depth analysis detailing your home's value as well as a comparison with similar homes in the area
Home Values in the Area
Average Home Value in this Area
Purchase History
| Date | Buyer | Sale Price | Title Company |
|---|---|---|---|
| Rsb Netcong Llc | $350,000 | First American Title | |
| Rsb Netcong Llc | $350,000 | First American Title | |
| Dn Realty Llc | $240,000 | Stewart Title | |
| Mcelroy Robert H | -- | None Available | |
| Repp Barbara M Mcelroy | -- | None Available |
Source: Public Records
Tax History
| Year | Tax Paid | Tax Assessment Tax Assessment Total Assessment is a certain percentage of the fair market value that is determined by local assessors to be the total taxable value of land and additions on the property. | Land | Improvement |
|---|---|---|---|---|
| 2025 | $8,465 | $240,000 | $107,400 | $132,600 |
| 2024 | $8,537 | $240,000 | $107,400 | $132,600 |
Source: Public Records
Map
Nearby Homes
- 22 Kelly Place
- 74 Main St
- 79 Main St
- 16-18 King St
- 35 Hillside Ave
- 20 Barone St
- 49 Brooklyn Rd
- 4 Elizabeth Ave
- 58 Brooklyn Rd
- 7 Walton Place
- 2 Roberts Place
- 8 Hillside Ave
- 8 Spencer St
- 0 Lawrence Ave
- 22 Lloyd Ave
- 329 Alpine Ct Unit 29
- 0 Swayze Pl Lawrence Ave
- 573 Dell Place Unit 73
- 2007A Stonegate Ln Unit 2007A
- 579 Dell Place Unit 79
Your Personal Tour Guide
Ask me questions while you tour the home.