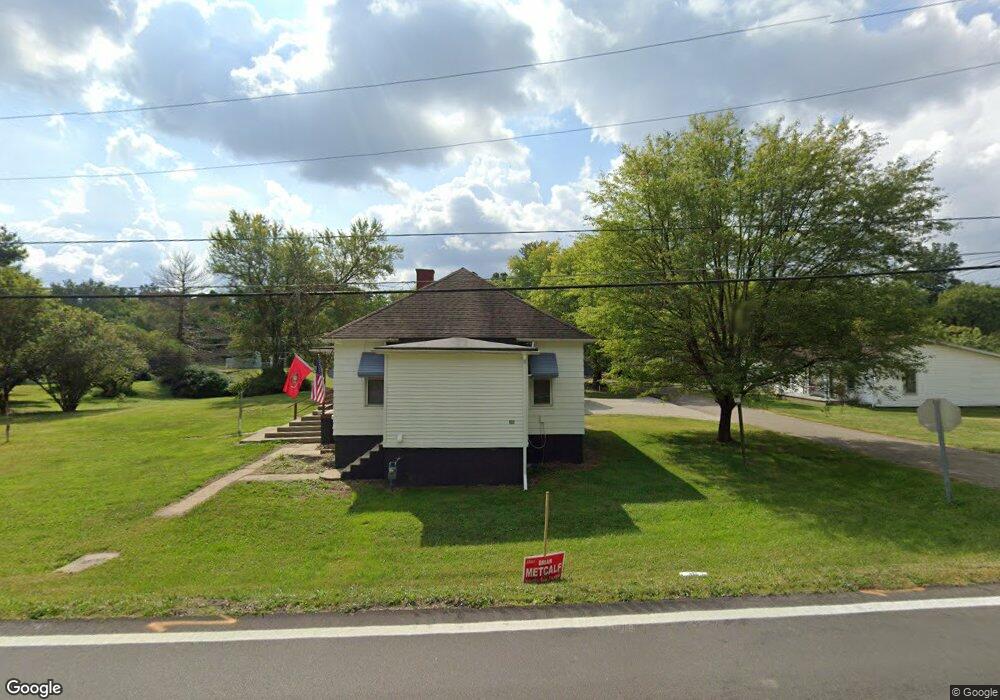
36 Main St S Trimble, OH 45782
Estimated Value: $49,000 - $114,000
2
Beds
1
Bath
992
Sq Ft
$78/Sq Ft
Est. Value
About This Home
This home is located at 36 Main St S, Trimble, OH 45782 and is currently estimated at $77,658, approximately $78 per square foot. 36 Main St S is a home with nearby schools including Trimble Elementary School, Trimble Middle School, and Trimble High School.
Ownership History
Date
Name
Owned For
Owner Type
Purchase Details
Closed on
Jun 2, 2023
Sold by
Athens County Sheriff
Bought by
Reitano Property Services Llc
Current Estimated Value
Purchase Details
Closed on
Feb 11, 2009
Sold by
Watson Stanley E
Bought by
Watson Evelyn C
Purchase Details
Closed on
May 30, 2001
Sold by
Watson Evelyn C
Bought by
Watson Evelyn C and Watson Stanley
Purchase Details
Closed on
Nov 17, 1998
Sold by
Watson Stanley E and Watson Evelyn C
Bought by
Watson Evelyn C
Purchase Details
Closed on
Apr 17, 1997
Sold by
Smith Everett and Smith Bessie M
Bought by
Watson Stanley E and Watson Evelyn C
Purchase Details
Closed on
Oct 30, 1996
Sold by
Rumyon Donald
Bought by
Smith Everett and Smith Bessie M
Purchase Details
Closed on
May 26, 1993
Sold by
Lasko James
Bought by
Rumyon Donald
Purchase Details
Closed on
Apr 1, 1988
Create a Home Valuation Report for This Property
The Home Valuation Report is an in-depth analysis detailing your home's value as well as a comparison with similar homes in the area
Purchase History
| Date | Buyer | Sale Price | Title Company |
|---|---|---|---|
| Reitano Property Services Llc | $32,000 | None Listed On Document | |
| Watson Evelyn C | -- | None Available | |
| Watson Evelyn C | -- | -- | |
| Watson Evelyn C | -- | -- | |
| Watson Stanley E | $25,000 | -- | |
| Smith Everett | $24,500 | -- | |
| Rumyon Donald | $25,000 | -- | |
| -- | $15,000 | -- |
Source: Public Records
Tax History
| Year | Tax Paid | Tax Assessment Tax Assessment Total Assessment is a certain percentage of the fair market value that is determined by local assessors to be the total taxable value of land and additions on the property. | Land | Improvement |
|---|---|---|---|---|
| 2024 | $766 | $13,410 | $1,310 | $12,100 |
| 2023 | $700 | $13,410 | $1,310 | $12,100 |
| 2022 | $721 | $12,230 | $1,310 | $10,920 |
| 2021 | $734 | $12,230 | $1,310 | $10,920 |
| 2020 | $700 | $12,230 | $1,310 | $10,920 |
| 2019 | $684 | $11,260 | $1,170 | $10,090 |
| 2018 | $734 | $11,260 | $1,170 | $10,090 |
| 2017 | $994 | $11,260 | $1,170 | $10,090 |
| 2016 | $709 | $10,540 | $1,170 | $9,370 |
| 2015 | $2,838 | $10,540 | $1,170 | $9,370 |
| 2014 | $2,838 | $10,540 | $1,170 | $9,370 |
| 2013 | $1,688 | $10,280 | $1,110 | $9,170 |
Source: Public Records
Map
Nearby Homes
- 8 Main
- 10535 S Poplar Dr
- 19477 Center
- 19500 Lake Dr
- 19346 Taylor Ridge Rd
- 0 Loudermilk Rd
- 0 Greens Run Rd
- 16 Braun St
- 20 Maple St
- 24 Cherry St
- 88 Front St
- 18344 Modoc Rd
- 140 Sycamore St
- 11807 Red Rock Rd
- 0 Red Rock Rd
- Lambert Rd
- 10271 Antle Orchard Rd
- Tract C Twist Tail Rd
- 14500 Wolfe Rd
- 14494 Keirns Rd
Your Personal Tour Guide
Ask me questions while you tour the home.