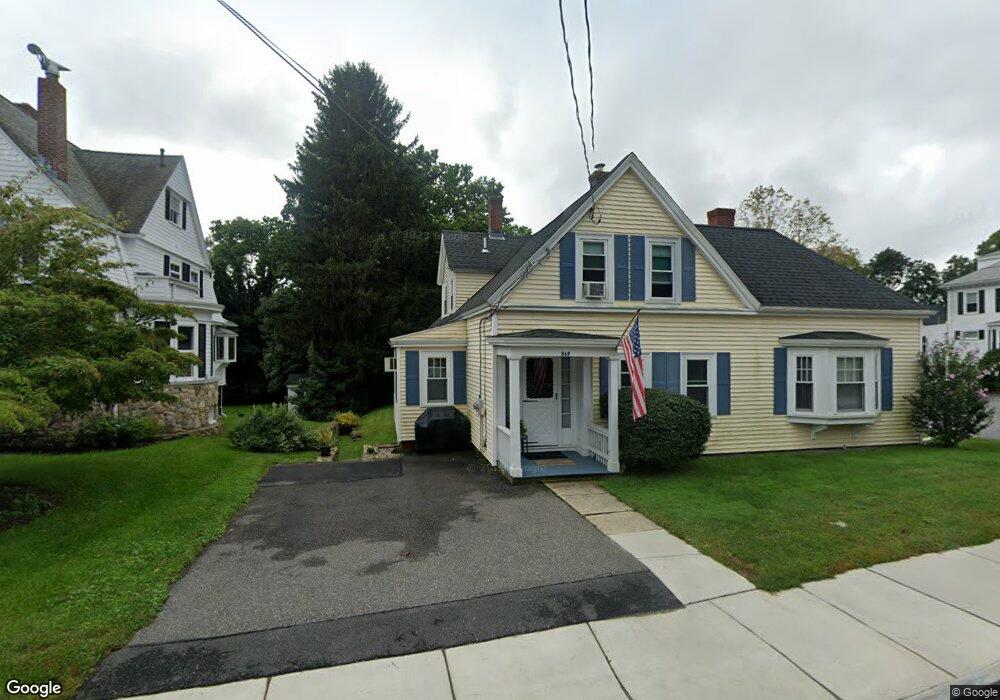
36 Main St Southborough, MA 01772
Estimated Value: $701,000 - $954,000
4
Beds
3
Baths
3,100
Sq Ft
$263/Sq Ft
Est. Value
About This Home
This home is located at 36 Main St, Southborough, MA 01772 and is currently estimated at $814,818, approximately $262 per square foot. 36 Main St is a home located in Worcester County with nearby schools including Mary E Finn School, Albert S. Woodward Memorial School, and Margaret A. Neary School.
Ownership History
Date
Name
Owned For
Owner Type
Purchase Details
Closed on
Feb 28, 2022
Sold by
Morris Stephen D and Morris Nancy G
Bought by
Stephen D Morris Ret and Morris
Current Estimated Value
Purchase Details
Closed on
Dec 4, 2009
Sold by
Markey Judith A and Markey Edward A
Bought by
Morris Stephen D and Morris Nancy G
Create a Home Valuation Report for This Property
The Home Valuation Report is an in-depth analysis detailing your home's value as well as a comparison with similar homes in the area
Home Values in the Area
Average Home Value in this Area
Purchase History
| Date | Buyer | Sale Price | Title Company |
|---|---|---|---|
| Stephen D Morris Ret | -- | None Available | |
| Stephen D Morris Ret | -- | None Available | |
| Stephen D Morris Ret | -- | None Available | |
| Morris Stephen D | $404,800 | -- | |
| 2200 South Rt | -- | -- | |
| Morris Stephen D | $404,800 | -- |
Source: Public Records
Tax History Compared to Growth
Tax History
| Year | Tax Paid | Tax Assessment Tax Assessment Total Assessment is a certain percentage of the fair market value that is determined by local assessors to be the total taxable value of land and additions on the property. | Land | Improvement |
|---|---|---|---|---|
| 2025 | $9,290 | $672,700 | $311,700 | $361,000 |
| 2024 | $8,909 | $640,500 | $307,400 | $333,100 |
| 2023 | $8,807 | $596,700 | $290,800 | $305,900 |
| 2022 | $8,405 | $516,300 | $254,700 | $261,600 |
| 2021 | $7,432 | $497,700 | $259,100 | $238,600 |
| 2020 | $8,015 | $481,100 | $248,000 | $233,100 |
| 2019 | $7,744 | $462,600 | $234,900 | $227,700 |
| 2018 | $7,019 | $434,900 | $226,000 | $208,900 |
| 2017 | $6,876 | $419,800 | $226,000 | $193,800 |
| 2016 | $6,263 | $395,900 | $221,800 | $174,100 |
| 2015 | $6,217 | $388,100 | $208,600 | $179,500 |
Source: Public Records
Map
Nearby Homes
- 25 Park St
- Lot 2 Quinn Rd
- 36 E Main St
- 58 Framingham Rd
- 56 Sears Rd
- lot 1 Sears Rd
- 9 John Matthews Rd
- 20 Clifford Rd
- 150 Framingham Rd
- 19 Maplecrest Dr
- 7 John St
- 8 Lorenzo Dr
- 14 Lovers Ln
- 11 Skylar Dr
- 15 Lovers Ln
- 9 Cherry St
- 1 Carriage Hill Cir Unit 1
- 6 Eastbrook Farm Ln
- 61-65 Turnpike
- 105 Fisher Rd