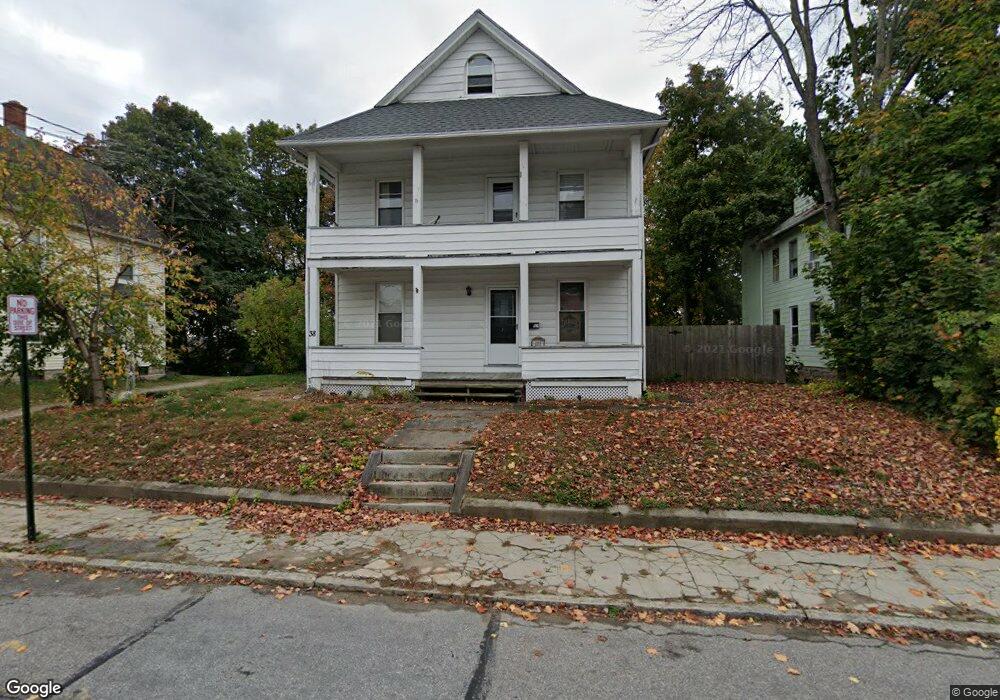
36 Maud St Torrington, CT 06790
Estimated Value: $277,000 - $307,000
4
Beds
2
Baths
2,146
Sq Ft
$139/Sq Ft
Est. Value
About This Home
This home is located at 36 Maud St, Torrington, CT 06790 and is currently estimated at $298,367, approximately $139 per square foot. 36 Maud St is a home located in Litchfield County with nearby schools including Torrington Middle School, Torrington High School, and St. Peter School.
Ownership History
Date
Name
Owned For
Owner Type
Purchase Details
Closed on
Nov 2, 2006
Sold by
Cook Matthew C and Cook Meaghan H
Bought by
Welch James K
Current Estimated Value
Home Financials for this Owner
Home Financials are based on the most recent Mortgage that was taken out on this home.
Original Mortgage
$182,360
Outstanding Balance
$109,437
Interest Rate
6.47%
Estimated Equity
$188,930
Purchase Details
Closed on
Aug 28, 2002
Sold by
Seibert Tyler D
Bought by
Cook Matthew C and Cook Meaghan H
Purchase Details
Closed on
Oct 27, 1993
Sold by
Torrington Sb
Bought by
Seibert Tyler D and Seibert Cynthia L
Home Financials for this Owner
Home Financials are based on the most recent Mortgage that was taken out on this home.
Original Mortgage
$64,800
Interest Rate
7.5%
Mortgage Type
Unknown
Purchase Details
Closed on
Jul 26, 1993
Sold by
Est Dacosta Joaquim and Bosco Adm Anita R
Bought by
Torrington Sav Bank
Create a Home Valuation Report for This Property
The Home Valuation Report is an in-depth analysis detailing your home's value as well as a comparison with similar homes in the area
Home Values in the Area
Average Home Value in this Area
Purchase History
| Date | Buyer | Sale Price | Title Company |
|---|---|---|---|
| Welch James K | $188,000 | -- | |
| Cook Matthew C | $29,000 | -- | |
| Seibert Tyler D | $72,000 | -- | |
| Torrington Sav Bank | $104,000 | -- |
Source: Public Records
Mortgage History
| Date | Status | Borrower | Loan Amount |
|---|---|---|---|
| Open | Torrington Sav Bank | $182,360 | |
| Previous Owner | Torrington Sav Bank | $64,800 |
Source: Public Records
Tax History
| Year | Tax Paid | Tax Assessment Tax Assessment Total Assessment is a certain percentage of the fair market value that is determined by local assessors to be the total taxable value of land and additions on the property. | Land | Improvement |
|---|---|---|---|---|
| 2025 | $6,842 | $177,940 | $20,370 | $157,570 |
| 2024 | $3,875 | $80,790 | $20,370 | $60,420 |
| 2023 | $3,875 | $80,790 | $20,370 | $60,420 |
| 2022 | $3,808 | $80,790 | $20,370 | $60,420 |
| 2021 | $3,730 | $80,790 | $20,370 | $60,420 |
| 2020 | $3,730 | $80,790 | $20,370 | $60,420 |
| 2019 | $3,481 | $75,400 | $20,370 | $55,030 |
| 2018 | $3,481 | $75,400 | $20,370 | $55,030 |
| 2017 | $3,450 | $75,400 | $20,370 | $55,030 |
| 2016 | $3,450 | $75,400 | $20,370 | $55,030 |
| 2015 | $3,450 | $75,400 | $20,370 | $55,030 |
| 2014 | $3,458 | $95,220 | $26,880 | $68,340 |
Source: Public Records
Map
Nearby Homes
- 291 E Main St
- 19 Harwinton Ave
- 116 Hillside Ave
- 279 E Elm St
- 238 Barton St
- 83 Birge St
- 444 Prospect St
- 408 Main St
- 118 Pearl St
- 195 Torrington Heights Rd
- 00 Church St
- 00 Winthrop St & E Elm St
- 277 Brightwood Ave
- 67 Amherst St
- 68 Wilson Ave Unit 103
- 68 Wilson Ave Unit 105
- 264 S Main St
- 42 Pulver St
- 118 Migeon Ave
- 29 Elton St
Your Personal Tour Guide
Ask me questions while you tour the home.