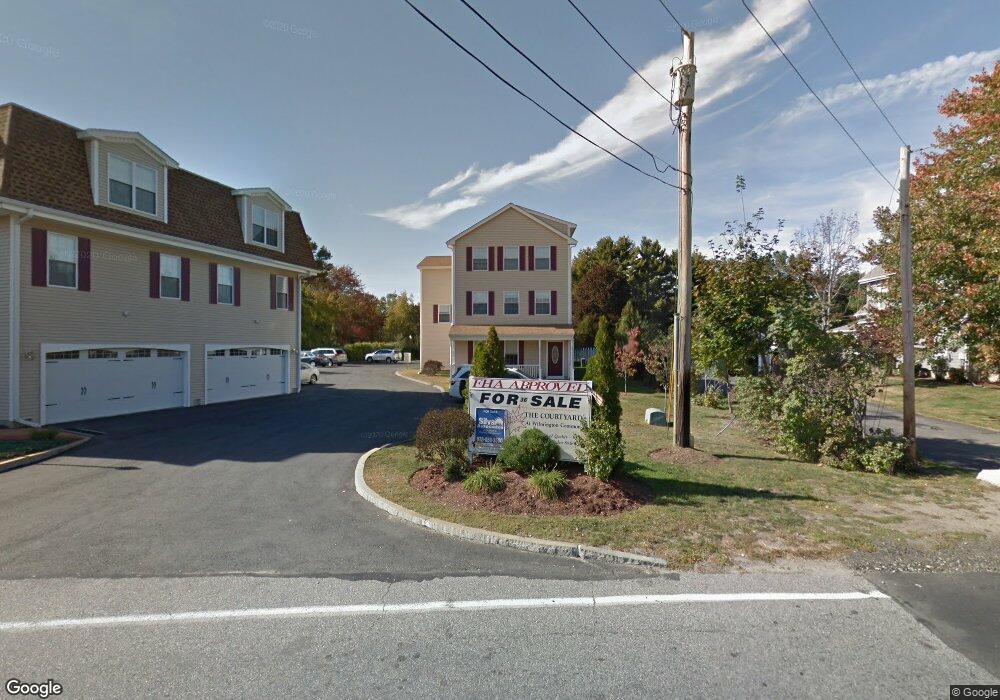
36 Middlesex Ave Unit A2 Wilmington, MA 01887
Estimated Value: $514,000 - $616,000
2
Beds
1
Bath
956
Sq Ft
$577/Sq Ft
Est. Value
About This Home
This home is located at 36 Middlesex Ave Unit A2, Wilmington, MA 01887 and is currently estimated at $551,474, approximately $576 per square foot. 36 Middlesex Ave Unit A2 is a home located in Middlesex County with nearby schools including Wilmington Middle School, Wilmington High School, and Abundant Life Christian School and Childcare.
Ownership History
Date
Name
Owned For
Owner Type
Purchase Details
Closed on
Oct 12, 2022
Sold by
Wilson Phlips Rt and Willard
Bought by
Mchugh Laurie
Current Estimated Value
Home Financials for this Owner
Home Financials are based on the most recent Mortgage that was taken out on this home.
Original Mortgage
$364,000
Outstanding Balance
$347,026
Interest Rate
5.66%
Mortgage Type
Purchase Money Mortgage
Estimated Equity
$204,448
Purchase Details
Closed on
Mar 4, 2020
Sold by
Mujica Ricardo A
Bought by
Wilson Phlips Rt
Purchase Details
Closed on
Mar 5, 2015
Sold by
Ganley Paul K and Ganley Nancy C
Bought by
Mujica Ricardo A
Home Financials for this Owner
Home Financials are based on the most recent Mortgage that was taken out on this home.
Original Mortgage
$241,600
Interest Rate
2.92%
Mortgage Type
New Conventional
Purchase Details
Closed on
Aug 23, 2013
Sold by
36 Middlesex Ave Rt and Eldredge
Bought by
Ganley Nancy C and Ganley Paul K
Create a Home Valuation Report for This Property
The Home Valuation Report is an in-depth analysis detailing your home's value as well as a comparison with similar homes in the area
Purchase History
| Date | Buyer | Sale Price | Title Company |
|---|---|---|---|
| Mchugh Laurie | $455,000 | None Available | |
| Wilson Phlips Rt | $353,000 | None Available | |
| Mujica Ricardo A | $302,000 | -- | |
| Ganley Nancy C | $288,000 | -- | |
| Ganley Nancy C | $288,000 | -- |
Source: Public Records
Mortgage History
| Date | Status | Borrower | Loan Amount |
|---|---|---|---|
| Open | Mchugh Laurie | $364,000 | |
| Previous Owner | Mujica Ricardo A | $241,600 |
Source: Public Records
Tax History
| Year | Tax Paid | Tax Assessment Tax Assessment Total Assessment is a certain percentage of the fair market value that is determined by local assessors to be the total taxable value of land and additions on the property. | Land | Improvement |
|---|---|---|---|---|
| 2025 | $5,596 | $488,700 | $0 | $488,700 |
| 2024 | $4,889 | $427,700 | $0 | $427,700 |
| 2023 | $4,536 | $379,900 | $0 | $379,900 |
| 2022 | $4,329 | $332,200 | $0 | $332,200 |
| 2021 | $4,307 | $311,200 | $0 | $311,200 |
| 2020 | $4,275 | $314,800 | $0 | $314,800 |
| 2019 | $4,120 | $299,600 | $0 | $299,600 |
| 2018 | $3,757 | $283,500 | $0 | $283,500 |
| 2017 | $3,757 | $260,000 | $0 | $260,000 |
| 2016 | $3,717 | $254,100 | $0 | $254,100 |
| 2015 | $3,564 | $248,000 | $0 | $248,000 |
| 2014 | $3,294 | $231,300 | $0 | $231,300 |
Source: Public Records
Map
Nearby Homes
- 3 Clark Terrace
- 31 Burlington Ave
- 9 Parker St
- 7 Cross St Unit 303
- 7 Cross St Unit 304
- 7 Cross St Unit 205
- 7 Cross St Unit 102
- 3 Molloy Rd
- 6 Patricia Cir
- 224 Burlington Ave
- 12 Hamlin Ln
- 56 Grove Ave
- 255 Burlington Ave
- 15 Mystic Ave
- 584 Woburn St
- 203 Lowell St Unit 316
- 203 Lowell St Unit 218
- 203 Lowell St Unit 120
- 203 Lowell St Unit 206
- 21 Marcia Rd
- 36 Middlesex Ave Unit Suite 1
- 36 Middlesex Ave Unit A12
- 36 Middlesex Ave Unit A11
- 36 Middlesex Ave Unit A10
- 36 Middlesex Ave Unit A9
- 36 Middlesex Ave Unit A8
- 36 Middlesex Ave Unit A7
- 36 Middlesex Ave Unit A6
- 36 Middlesex Ave Unit A5
- 36 Middlesex Ave Unit A4
- 36 Middlesex Ave Unit A3
- 36 Middlesex Ave Unit 12
- 36 Middlesex Ave Unit 11
- 36 Middlesex Ave Unit 10
- 36 Middlesex Ave Unit 8
- 36 Middlesex Ave Unit 7
- 36 Middlesex Ave Unit 6
- 36 Middlesex Ave Unit 5
- 36 Middlesex Ave Unit 4
- 36 Middlesex Ave Unit 3
Your Personal Tour Guide
Ask me questions while you tour the home.