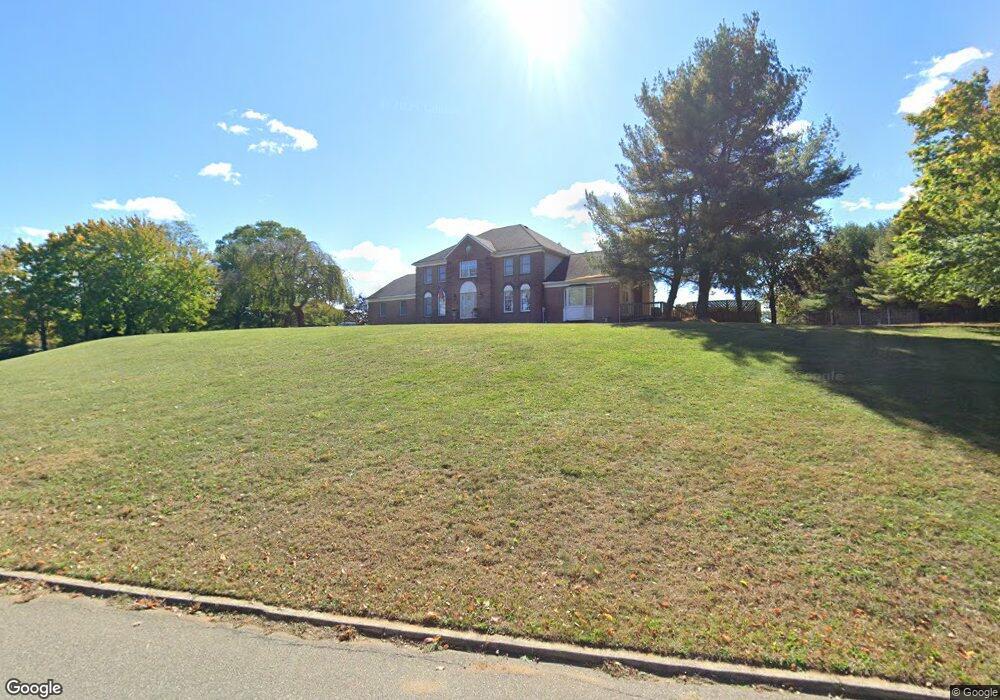
36 Moore Rd Marlboro, NJ 07746
Estimated Value: $1,139,689 - $1,320,000
3
Beds
2
Baths
3,426
Sq Ft
$362/Sq Ft
Est. Value
About This Home
This home is located at 36 Moore Rd, Marlboro, NJ 07746 and is currently estimated at $1,241,422, approximately $362 per square foot. 36 Moore Rd is a home located in Monmouth County with nearby schools including Frank J. Dugan Elementary School, Marlboro Middle School, and Marlboro High School.
Ownership History
Date
Name
Owned For
Owner Type
Purchase Details
Closed on
Sep 19, 1997
Sold by
Citicorp North
Bought by
Wilshire Funding
Current Estimated Value
Home Financials for this Owner
Home Financials are based on the most recent Mortgage that was taken out on this home.
Original Mortgage
$248,000
Interest Rate
7.38%
Purchase Details
Closed on
Jul 28, 1997
Sold by
Bankers Trust
Bought by
Thomas Ambrosio
Home Financials for this Owner
Home Financials are based on the most recent Mortgage that was taken out on this home.
Original Mortgage
$248,000
Interest Rate
7.38%
Create a Home Valuation Report for This Property
The Home Valuation Report is an in-depth analysis detailing your home's value as well as a comparison with similar homes in the area
Home Values in the Area
Average Home Value in this Area
Purchase History
| Date | Buyer | Sale Price | Title Company |
|---|---|---|---|
| Wilshire Funding | $270,084 | -- | |
| Thomas Ambrosio | $330,000 | -- |
Source: Public Records
Mortgage History
| Date | Status | Borrower | Loan Amount |
|---|---|---|---|
| Previous Owner | Thomas Ambrosio | $248,000 |
Source: Public Records
Tax History Compared to Growth
Tax History
| Year | Tax Paid | Tax Assessment Tax Assessment Total Assessment is a certain percentage of the fair market value that is determined by local assessors to be the total taxable value of land and additions on the property. | Land | Improvement |
|---|---|---|---|---|
| 2025 | $15,400 | $617,500 | $177,000 | $440,500 |
| 2024 | $14,721 | $617,500 | $177,000 | $440,500 |
| 2023 | $14,721 | $617,500 | $177,000 | $440,500 |
| 2022 | $14,345 | $617,500 | $177,000 | $440,500 |
| 2021 | $14,345 | $617,500 | $177,000 | $440,500 |
| 2020 | $14,196 | $617,500 | $177,000 | $440,500 |
| 2019 | $14,203 | $617,500 | $177,000 | $440,500 |
| 2018 | $13,962 | $617,500 | $177,000 | $440,500 |
| 2017 | $13,690 | $617,500 | $177,000 | $440,500 |
| 2016 | $13,634 | $617,500 | $177,000 | $440,500 |
| 2015 | $13,183 | $606,100 | $177,000 | $429,100 |
| 2014 | $16,795 | $764,100 | $352,000 | $412,100 |
Source: Public Records
Map
Nearby Homes
- 93 Buckley Rd
- 140 Palisade Dr
- 21 Holly Hill Rd
- 22 Pecan Valley Dr
- Brookton Plan at The Parc at Marlboro - The Brookton Collection
- Monterey Plan at The Parc at Marlboro - The Monterey Collection
- 3506 Expedition St
- 3504 Expedition St
- 9 Yellowbrook Rd
- 3503 Expedition St
- 3502 Expedition St
- 3501 Expedition St
- 1006 Navigator Ave
- 170 Palisade Dr
- 67 School Rd E
- 33 Camille Ln
- 5 Green Springs Way
- 620 Kirwan Ct
- 63 Carriage Hill Dr
- 10 Livingston Ct