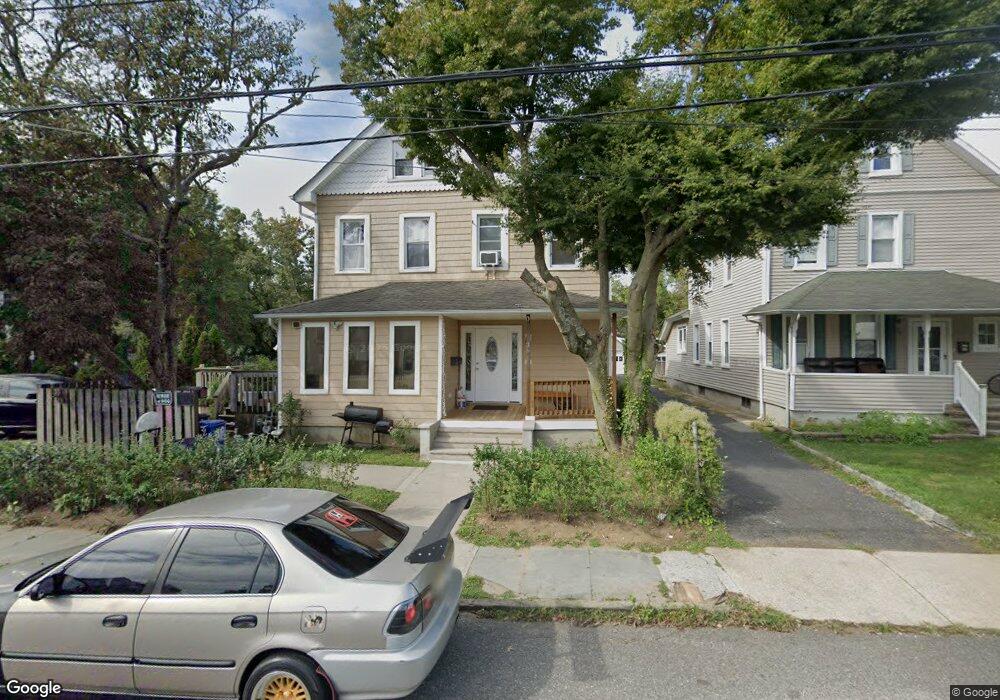
36 Morrell St Long Branch, NJ 07740
Estimated Value: $788,000 - $958,000
6
Beds
3
Baths
3,325
Sq Ft
$268/Sq Ft
Est. Value
About This Home
This home is located at 36 Morrell St, Long Branch, NJ 07740 and is currently estimated at $890,306, approximately $267 per square foot. 36 Morrell St is a home located in Monmouth County with nearby schools including Long Branch High School and Holy Trinity School.
Ownership History
Date
Name
Owned For
Owner Type
Purchase Details
Closed on
Jan 29, 1998
Sold by
Emc Mortgage
Bought by
Benavides Jose
Current Estimated Value
Home Financials for this Owner
Home Financials are based on the most recent Mortgage that was taken out on this home.
Original Mortgage
$115,000
Outstanding Balance
$20,268
Interest Rate
6.95%
Mortgage Type
FHA
Estimated Equity
$870,038
Purchase Details
Closed on
Mar 21, 1997
Sold by
Umlic Ten Corp
Bought by
Emc Mortgage
Create a Home Valuation Report for This Property
The Home Valuation Report is an in-depth analysis detailing your home's value as well as a comparison with similar homes in the area
Home Values in the Area
Average Home Value in this Area
Purchase History
| Date | Buyer | Sale Price | Title Company |
|---|---|---|---|
| Benavides Jose | $125,000 | -- | |
| Emc Mortgage | $82,204 | -- |
Source: Public Records
Mortgage History
| Date | Status | Borrower | Loan Amount |
|---|---|---|---|
| Open | Benavides Jose | $115,000 |
Source: Public Records
Tax History Compared to Growth
Tax History
| Year | Tax Paid | Tax Assessment Tax Assessment Total Assessment is a certain percentage of the fair market value that is determined by local assessors to be the total taxable value of land and additions on the property. | Land | Improvement |
|---|---|---|---|---|
| 2025 | $11,961 | $861,400 | $263,800 | $597,600 |
| 2024 | $10,924 | $778,200 | $233,800 | $544,400 |
| 2023 | $10,924 | $703,400 | $183,800 | $519,600 |
| 2022 | $9,897 | $582,600 | $124,800 | $457,800 |
| 2021 | $9,897 | $494,600 | $104,800 | $389,800 |
| 2020 | $10,059 | $481,300 | $93,800 | $387,500 |
| 2019 | $9,760 | $464,300 | $94,800 | $369,500 |
| 2018 | $9,530 | $450,800 | $94,800 | $356,000 |
| 2017 | $9,151 | $444,000 | $94,800 | $349,200 |
| 2016 | $8,892 | $440,000 | $99,800 | $340,200 |
| 2015 | $6,298 | $282,800 | $100,300 | $182,500 |
| 2014 | $5,785 | $273,800 | $111,800 | $162,000 |
Source: Public Records
Map
Nearby Homes
- 399 Willow Ave
- 28 Norwood Ave
- 88 Norwood Ave
- 119 Washington St
- 298 Poole Ave
- 39 Slocum Place
- 14 Slocum Place
- 364 Westwood Ave Unit 39
- 364 Westwood Ave Unit 71
- 364 Westwood Ave Unit 21
- 631 Irving Place
- 303 Westwood Ave
- 2 Hilltop Rd
- 377 Westwood Ave
- 215 Cleveland Ave
- 144 Westwood Ave
- 565 Joline Ave
- 440 W End Ave
- 434 Westwood Ave
- 264 Norwood Ave