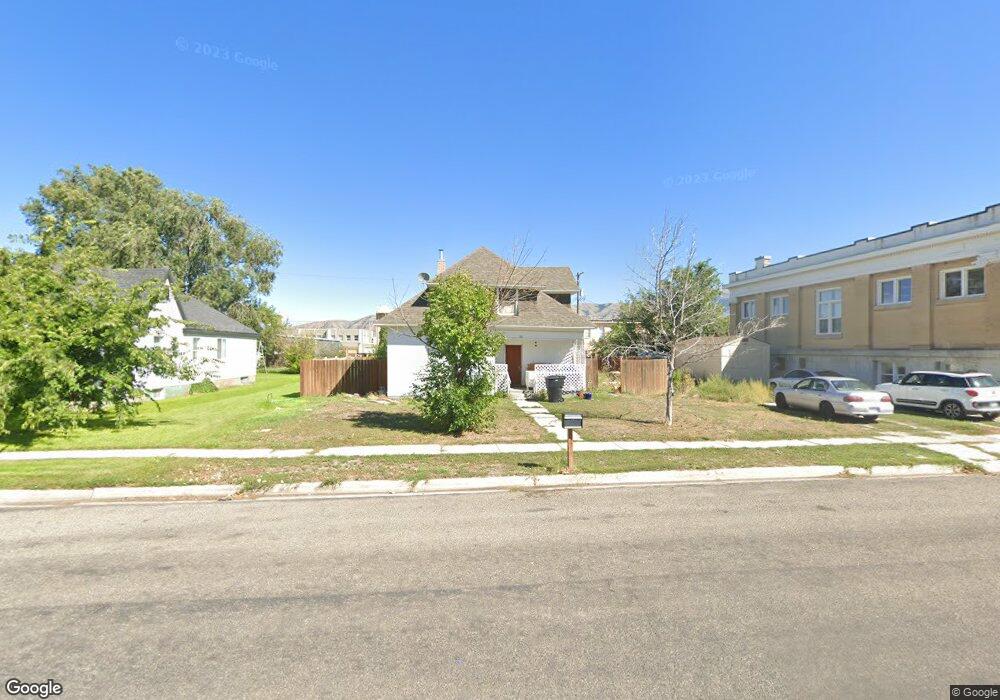
36 N 100 W Garland, UT 84312
Estimated Value: $323,000 - $358,000
4
Beds
1
Bath
1,627
Sq Ft
$205/Sq Ft
Est. Value
About This Home
This home is located at 36 N 100 W, Garland, UT 84312 and is currently estimated at $334,222, approximately $205 per square foot. 36 N 100 W is a home located in Box Elder County with nearby schools including Fielding School, Bear River Middle School, and Alice C. Harris Intermediate School.
Ownership History
Date
Name
Owned For
Owner Type
Purchase Details
Closed on
Apr 29, 2014
Sold by
Camarillo Krystle and Harper Krystle
Bought by
Memmott Dennis
Current Estimated Value
Home Financials for this Owner
Home Financials are based on the most recent Mortgage that was taken out on this home.
Original Mortgage
$93,367
Outstanding Balance
$71,023
Interest Rate
4.28%
Mortgage Type
New Conventional
Estimated Equity
$263,199
Purchase Details
Closed on
Feb 26, 2009
Sold by
Harper Kyle B and Harper Krystle
Bought by
Harper Brystle
Home Financials for this Owner
Home Financials are based on the most recent Mortgage that was taken out on this home.
Original Mortgage
$65,000
Interest Rate
5.06%
Mortgage Type
Purchase Money Mortgage
Purchase Details
Closed on
Sep 28, 2006
Sold by
Utah Housing Corp
Bought by
Secretary Of Hud
Purchase Details
Closed on
Aug 23, 2006
Sold by
Atwood Hugh A and Atwood Tawny L
Bought by
Utah Housing Corp
Create a Home Valuation Report for This Property
The Home Valuation Report is an in-depth analysis detailing your home's value as well as a comparison with similar homes in the area
Home Values in the Area
Average Home Value in this Area
Purchase History
| Date | Buyer | Sale Price | Title Company |
|---|---|---|---|
| Memmott Dennis | -- | None Available | |
| Harper Brystle | -- | -- | |
| Secretary Of Hud | -- | None Available | |
| Utah Housing Corp | -- | Lincoln Title |
Source: Public Records
Mortgage History
| Date | Status | Borrower | Loan Amount |
|---|---|---|---|
| Open | Memmott Dennis | $93,367 | |
| Previous Owner | Harper Brystle | $65,000 |
Source: Public Records
Tax History Compared to Growth
Tax History
| Year | Tax Paid | Tax Assessment Tax Assessment Total Assessment is a certain percentage of the fair market value that is determined by local assessors to be the total taxable value of land and additions on the property. | Land | Improvement |
|---|---|---|---|---|
| 2025 | $1,814 | $276,673 | $105,000 | $171,673 |
| 2024 | $1,583 | $271,860 | $100,000 | $171,860 |
| 2023 | $1,491 | $252,529 | $90,000 | $162,529 |
| 2022 | $1,243 | $108,558 | $13,750 | $94,808 |
| 2021 | $1,093 | $131,037 | $25,000 | $106,037 |
| 2020 | $943 | $131,037 | $25,000 | $106,037 |
| 2019 | $887 | $65,361 | $13,750 | $51,611 |
| 2018 | $620 | $42,707 | $13,750 | $28,957 |
| 2017 | $644 | $77,649 | $13,750 | $52,649 |
| 2016 | $613 | $41,328 | $13,750 | $27,578 |
| 2015 | $583 | $38,821 | $13,750 | $25,071 |
| 2014 | $583 | $0 | $0 | $0 |
| 2013 | -- | $37,628 | $13,338 | $24,290 |
Source: Public Records
Map
Nearby Homes