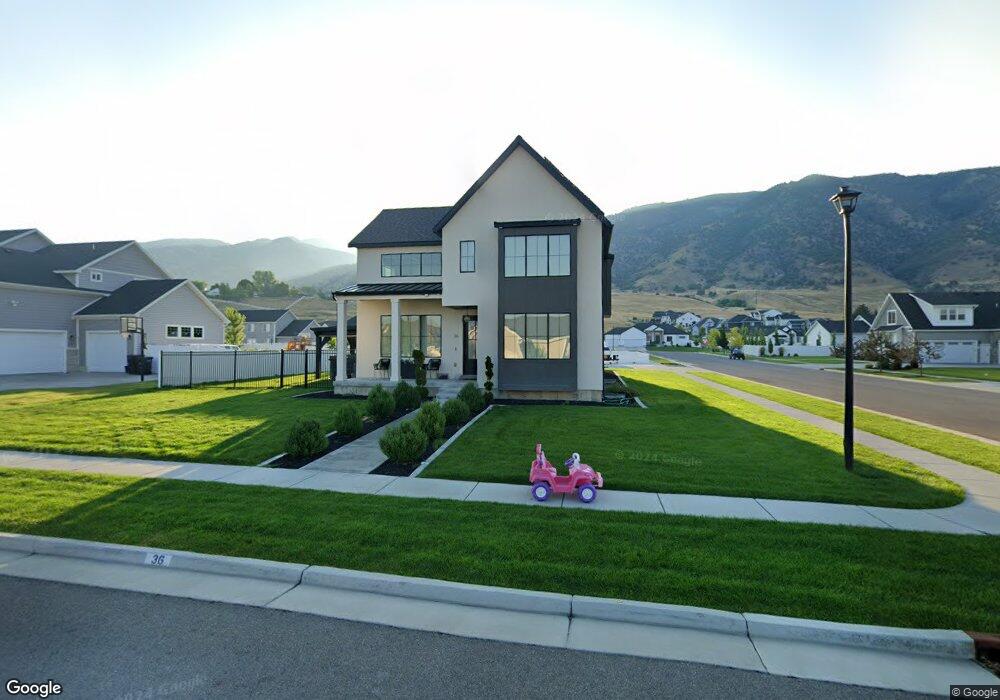
36 N 470 E Millville, UT 84326
Estimated Value: $623,000 - $844,000
Studio
--
Bath
2,634
Sq Ft
$282/Sq Ft
Est. Value
About This Home
This home is located at 36 N 470 E, Millville, UT 84326 and is currently estimated at $741,969, approximately $281 per square foot. 36 N 470 E is a home with nearby schools including Millville School, Spring Creek Middle School, and South Cache Middle School.
Ownership History
Date
Name
Owned For
Owner Type
Purchase Details
Closed on
Oct 23, 2020
Sold by
Hill Jase L and Hill Kinsey
Bought by
Hill Jase and Hill Kinsey
Current Estimated Value
Home Financials for this Owner
Home Financials are based on the most recent Mortgage that was taken out on this home.
Original Mortgage
$396,000
Outstanding Balance
$275,840
Interest Rate
2.8%
Mortgage Type
New Conventional
Estimated Equity
$466,129
Purchase Details
Closed on
Feb 6, 2019
Sold by
Grunig Jed
Bought by
Hill Jase L and Hill Kinsey
Home Financials for this Owner
Home Financials are based on the most recent Mortgage that was taken out on this home.
Original Mortgage
$70,400
Interest Rate
4.5%
Mortgage Type
Balloon
Purchase Details
Closed on
Jul 5, 2018
Sold by
Mond Aire Heights Llc
Bought by
Grunig Jed
Home Financials for this Owner
Home Financials are based on the most recent Mortgage that was taken out on this home.
Original Mortgage
$57,600
Interest Rate
4.5%
Mortgage Type
New Conventional
Create a Home Valuation Report for This Property
The Home Valuation Report is an in-depth analysis detailing your home's value as well as a comparison with similar homes in the area
Purchase History
| Date | Buyer | Sale Price | Title Company |
|---|---|---|---|
| Hill Jase | -- | Cache Title Company Inc | |
| Hill Jase L | -- | Cache Title Company Inc | |
| Grunig Jed | -- | Hickman Land Title Co |
Source: Public Records
Mortgage History
| Date | Status | Borrower | Loan Amount |
|---|---|---|---|
| Open | Hill Jase | $396,000 | |
| Closed | Hill Jase L | $70,400 | |
| Previous Owner | Grunig Jed | $57,600 |
Source: Public Records
Tax History
| Year | Tax Paid | Tax Assessment Tax Assessment Total Assessment is a certain percentage of the fair market value that is determined by local assessors to be the total taxable value of land and additions on the property. | Land | Improvement |
|---|---|---|---|---|
| 2025 | $2,679 | $400,735 | $0 | $0 |
| 2024 | $288 | $401,310 | $0 | $0 |
| 2023 | $306 | $398,475 | $0 | $0 |
| 2022 | $3,211 | $398,475 | $0 | $0 |
| 2021 | $29 | $547,300 | $85,000 | $462,300 |
| 2020 | $2,698 | $487,000 | $85,000 | $402,000 |
| 2019 | $903 | $85,000 | $85,000 | $221,100 |
| 2018 | $866 | $80,000 | $80,000 | $0 |
Source: Public Records
Map
Nearby Homes
- 444 E 100 N
- 164 N 500 E Unit 34
- 649 E 250 N Unit 16
- 1139 S 470 E
- 520 E 1130 S
- 1211 Grandview Dr
- 109 E 200 S
- 1075 Grandview Dr
- 294 E 875 S
- 281 N Sherwood Dr Unit 24
- 150 S Hwy 165 W Unit 73
- 693 E Spring Creek Pkwy Unit 20
- 8 E 400 N
- 575 N 140 E
- 265 Canyon Rd
- 210 E 2100 S
- 510 Spring Creek Rd
- 659 S 330 W
- 508 S 200 W
- 599 S 330 W
Your Personal Tour Guide
Ask me questions while you tour the home.