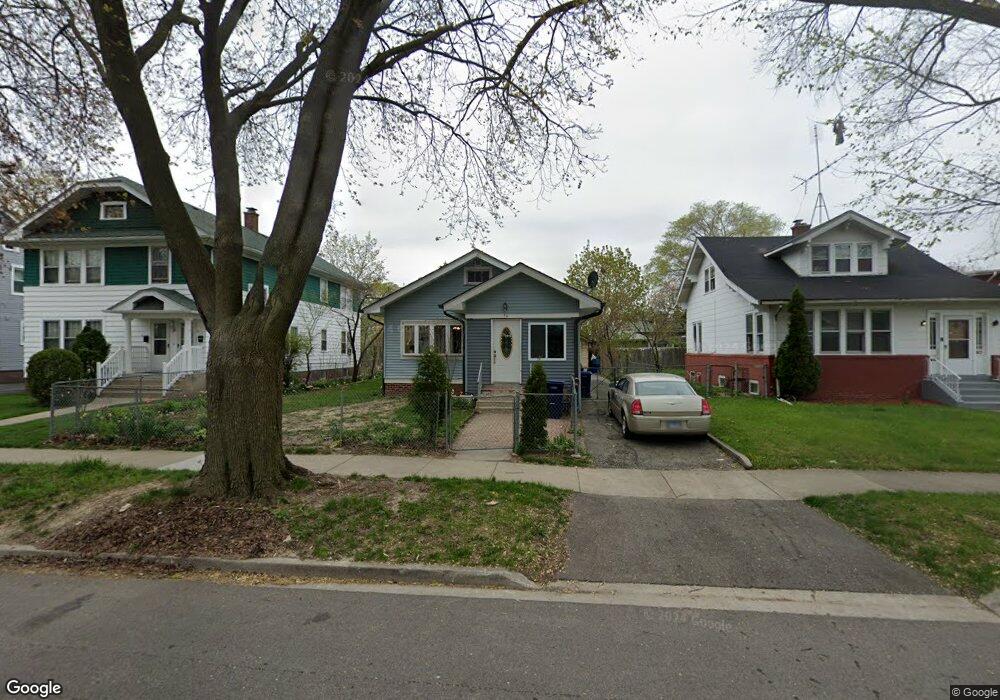
36 N Elmwood Ave Waukegan, IL 60085
West Waukegan NeighborhoodEstimated Value: $201,044 - $219,000
2
Beds
1
Bath
998
Sq Ft
$212/Sq Ft
Est. Value
About This Home
This home is located at 36 N Elmwood Ave, Waukegan, IL 60085 and is currently estimated at $211,761, approximately $212 per square foot. 36 N Elmwood Ave is a home located in Lake County with nearby schools including Hyde Park Elementary School, Miguel Juarez Middle School, and Waukegan High School.
Ownership History
Date
Name
Owned For
Owner Type
Purchase Details
Closed on
Sep 9, 2003
Sold by
Lazcon Ramon and Lazcon Martha
Bought by
Lazcon Ramon and Lazcon Martha
Current Estimated Value
Home Financials for this Owner
Home Financials are based on the most recent Mortgage that was taken out on this home.
Original Mortgage
$92,000
Interest Rate
6.43%
Mortgage Type
Purchase Money Mortgage
Purchase Details
Closed on
Nov 5, 2002
Sold by
Tobar Jose and Tobar Maria M
Bought by
Tobar Jose
Home Financials for this Owner
Home Financials are based on the most recent Mortgage that was taken out on this home.
Original Mortgage
$108,000
Interest Rate
4.25%
Purchase Details
Closed on
Mar 23, 2000
Sold by
Lazcon Ramon and Rajardo Ramon
Bought by
Lazcon Ramon and Lazcon Jose
Home Financials for this Owner
Home Financials are based on the most recent Mortgage that was taken out on this home.
Original Mortgage
$93,600
Interest Rate
8.39%
Create a Home Valuation Report for This Property
The Home Valuation Report is an in-depth analysis detailing your home's value as well as a comparison with similar homes in the area
Home Values in the Area
Average Home Value in this Area
Purchase History
| Date | Buyer | Sale Price | Title Company |
|---|---|---|---|
| Lazcon Ramon | -- | Plaza Title Llc | |
| Tobar Jose | -- | Ticor | |
| Lazcon Ramon | -- | Prairie Title |
Source: Public Records
Mortgage History
| Date | Status | Borrower | Loan Amount |
|---|---|---|---|
| Closed | Lazcon Ramon | $92,000 | |
| Closed | Tobar Jose | $108,000 | |
| Closed | Lazcon Ramon | $93,600 |
Source: Public Records
Tax History Compared to Growth
Tax History
| Year | Tax Paid | Tax Assessment Tax Assessment Total Assessment is a certain percentage of the fair market value that is determined by local assessors to be the total taxable value of land and additions on the property. | Land | Improvement |
|---|---|---|---|---|
| 2024 | $2,011 | $49,200 | $8,961 | $40,239 |
| 2023 | $3,063 | $44,049 | $8,023 | $36,026 |
| 2022 | $3,063 | $37,328 | $7,313 | $30,015 |
| 2021 | $2,258 | $32,662 | $6,888 | $25,774 |
| 2020 | $2,202 | $30,429 | $6,417 | $24,012 |
| 2019 | $2,120 | $27,883 | $5,880 | $22,003 |
| 2018 | $2,327 | $23,534 | $6,937 | $16,597 |
| 2017 | $2,108 | $20,821 | $6,137 | $14,684 |
| 2016 | $1,869 | $18,093 | $5,333 | $12,760 |
| 2015 | $1,722 | $16,193 | $4,773 | $11,420 |
| 2014 | $2,550 | $20,608 | $5,111 | $15,497 |
| 2012 | $2,516 | $22,328 | $5,538 | $16,790 |
Source: Public Records
Map
Nearby Homes
- 132 Dorchester Ct
- 49 S Lewis Ave
- 1416 Hamilton Ct
- 1521 Catalpa Ave
- 2115 Lydia St
- 23 N Jackson St
- 0 Brookside Ave
- 615 Tiffany Dr
- 1213 Grand Ave
- 12601 W Atlantic Ave
- 2116 & 2101 Williamsburg Dr
- 24 Washington Terrace
- 28 N Saint James St
- 446 S Jackson St
- 304 Powell Ave
- 613 Washington St
- 824 N Butrick St
- 610 Bluff St
- 511 Chestnut St
- 428 N Poplar St
- 32 N Elmwood Ave
- 40 N Elmwood Ave
- 42 N Elmwood Ave
- 28 N Elmwood Ave
- 35 N Lewis Ave
- 39 N Lewis Ave
- 31 N Lewis Ave
- 24 N Elmwood Ave
- 48 N Elmwood Ave
- 43 N Lewis Ave
- 27 N Lewis Ave
- 35 N Elmwood Ave
- 39 N Elmwood Ave
- 31 N Elmwood Ave
- 23 N Lewis Ave
- 47 N Lewis Ave
- 104 N Elmwood Ave
- 29 N Elmwood Ave
- 43 N Elmwood Ave
- 20 N Elmwood Ave