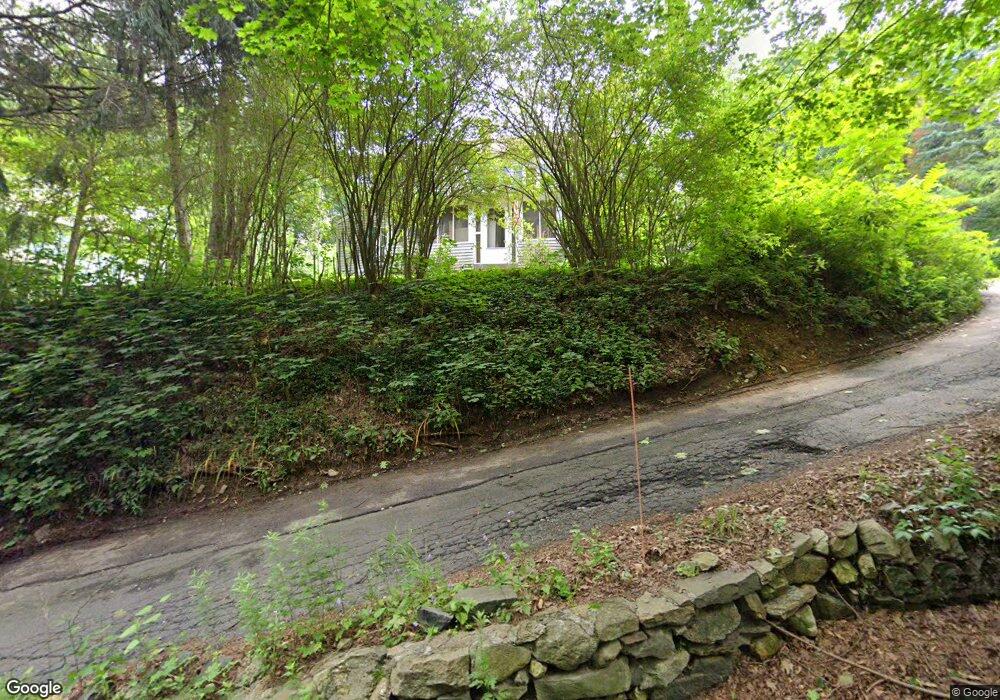
36 Nashville Rd Bethel, CT 06801
Estimated Value: $353,000 - $479,000
2
Beds
2
Baths
1,400
Sq Ft
$297/Sq Ft
Est. Value
About This Home
This home is located at 36 Nashville Rd, Bethel, CT 06801 and is currently estimated at $415,961, approximately $297 per square foot. 36 Nashville Rd is a home located in Fairfield County with nearby schools including R.M.T. Johnson School, Bethel Middle School, and Bethel High School.
Ownership History
Date
Name
Owned For
Owner Type
Purchase Details
Closed on
Apr 27, 2020
Sold by
Usa Hud
Bought by
Sabella Scott V
Current Estimated Value
Purchase Details
Closed on
Nov 6, 2019
Sold by
Pnc Bank Na
Bought by
Usa Hud
Purchase Details
Closed on
Aug 28, 2019
Sold by
Scalero Frank
Bought by
Pnc Bank Na
Purchase Details
Closed on
Oct 26, 2011
Sold by
Mccann Anita L
Bought by
Mccann Anita L and Mccann Briana
Purchase Details
Closed on
Jan 23, 2009
Sold by
Beneficial Mortgage Co
Bought by
Mccann Anita
Purchase Details
Closed on
Dec 30, 1991
Sold by
Mcintosh Alan L and Mcintosh Keith W
Bought by
Foster John B and Foster Julie
Purchase Details
Closed on
Sep 30, 1988
Sold by
Bergfors Carl E
Bought by
Schneider Susan K
Create a Home Valuation Report for This Property
The Home Valuation Report is an in-depth analysis detailing your home's value as well as a comparison with similar homes in the area
Home Values in the Area
Average Home Value in this Area
Purchase History
| Date | Buyer | Sale Price | Title Company |
|---|---|---|---|
| Sabella Scott V | $242,000 | None Available | |
| Usa Hud | -- | None Available | |
| Pnc Bank Na | -- | -- | |
| Mccann Anita L | -- | -- | |
| Mccann Anita | $78,000 | -- | |
| Foster John B | $150,000 | -- | |
| Schneider Susan K | $90,000 | -- |
Source: Public Records
Mortgage History
| Date | Status | Borrower | Loan Amount |
|---|---|---|---|
| Previous Owner | Schneider Susan K | $271,051 | |
| Previous Owner | Schneider Susan K | $190,000 |
Source: Public Records
Tax History Compared to Growth
Tax History
| Year | Tax Paid | Tax Assessment Tax Assessment Total Assessment is a certain percentage of the fair market value that is determined by local assessors to be the total taxable value of land and additions on the property. | Land | Improvement |
|---|---|---|---|---|
| 2025 | $5,590 | $183,820 | $85,260 | $98,560 |
| 2024 | $5,362 | $183,820 | $85,260 | $98,560 |
| 2023 | $5,226 | $183,820 | $85,260 | $98,560 |
| 2022 | $4,990 | $144,270 | $85,260 | $59,010 |
| 2021 | $4,943 | $144,270 | $85,260 | $59,010 |
| 2020 | $4,868 | $144,270 | $85,260 | $59,010 |
| 2019 | $4,820 | $144,270 | $85,260 | $59,010 |
| 2018 | $4,742 | $144,270 | $85,260 | $59,010 |
| 2017 | $4,973 | $151,240 | $81,590 | $69,650 |
| 2016 | $4,865 | $151,240 | $81,590 | $69,650 |
| 2015 | $4,867 | $151,240 | $81,590 | $69,650 |
| 2014 | $4,856 | $151,240 | $81,590 | $69,650 |
Source: Public Records
Map
Nearby Homes
- 48 & 50 Nashville Rd
- 95 Chestnut St Unit D
- 66 Nashville Rd Unit L
- 2 Chestnut St
- 4 Bailey Blvd Unit 4
- 4 Winthrop Rd
- 51 Kingswood Dr
- 148 Grassy Plain St Unit B
- 2 Judd Ave
- 12 Canaan Dr
- 12 Eagle Rock Hill Unit 12
- 21 Oven Rock Rd
- 2 Honey Hollow Dr
- 10 Buckboard Ridge
- 66 Putnam Park Rd
- 27 Long Meadow Ln
- 134 Nashville Rd
- 37 Whittlesey Dr
- 89 Knollwood Dr
- 17 Briar Ridge Dr Unit 17
- 34 Nashville Rd
- 40 Nashville Rd
- 34 1/2 Nashville Rd
- 34A Nashville Rd
- 42 Nashville Rd
- 42 Nashville Rd Unit 5
- 42 Nashville Rd Unit 3
- 36 1/2 Nashville Rd
- 32 Nashville Rd
- 30 Nashville Rd
- 29 Nashville Rd
- 46 Nashville Rd
- 28 Nashville Rd
- 57 Chestnut St
- 47 Nashville Rd
- 55 Chestnut St
- 65 Chestnut St
- 73 Chestnut St
- 26 Nashville Rd
- 27 Nashville Rd