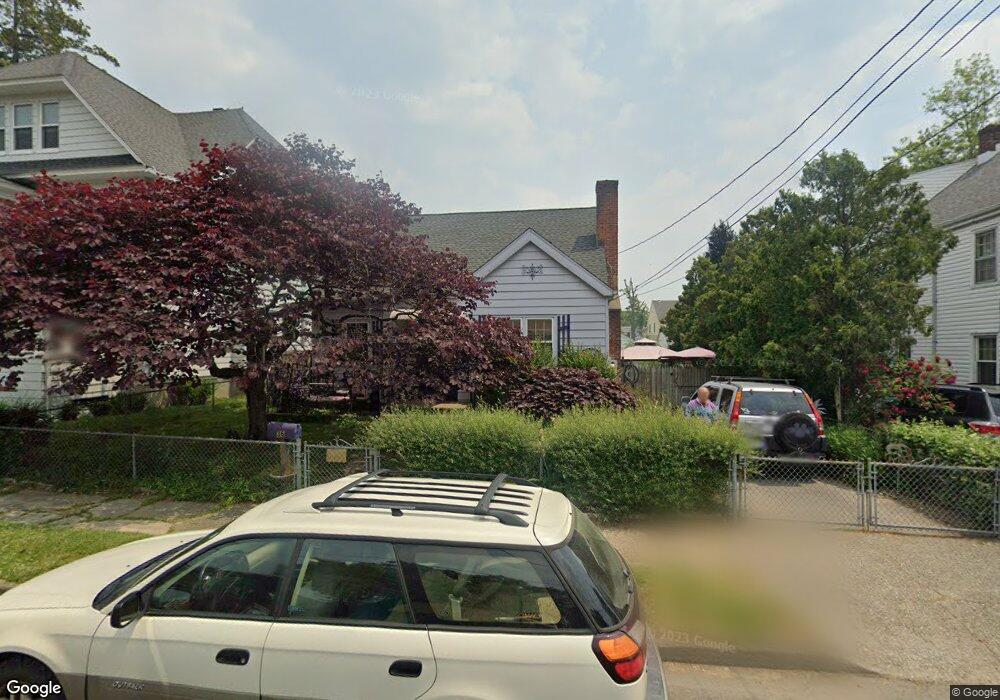
36 Newton St Bridgeport, CT 06605
Black Rock NeighborhoodEstimated Value: $329,000 - $636,000
2
Beds
1
Bath
972
Sq Ft
$495/Sq Ft
Est. Value
About This Home
This home is located at 36 Newton St, Bridgeport, CT 06605 and is currently estimated at $481,294, approximately $495 per square foot. 36 Newton St is a home located in Fairfield County with nearby schools including Holland Hill Elementary, Fairfield Ludlowe High School, and Park City Prep Charter School.
Ownership History
Date
Name
Owned For
Owner Type
Purchase Details
Closed on
Sep 30, 2013
Sold by
Sessa Frances
Bought by
Caddy Debra and Rogers John
Current Estimated Value
Home Financials for this Owner
Home Financials are based on the most recent Mortgage that was taken out on this home.
Original Mortgage
$135,900
Outstanding Balance
$101,800
Interest Rate
4.42%
Estimated Equity
$379,494
Create a Home Valuation Report for This Property
The Home Valuation Report is an in-depth analysis detailing your home's value as well as a comparison with similar homes in the area
Home Values in the Area
Average Home Value in this Area
Purchase History
| Date | Buyer | Sale Price | Title Company |
|---|---|---|---|
| Caddy Debra | $169,900 | -- | |
| Caddy Debra | $169,900 | -- |
Source: Public Records
Mortgage History
| Date | Status | Borrower | Loan Amount |
|---|---|---|---|
| Open | Caddy Debra | $135,900 | |
| Closed | Caddy Debra | $135,900 |
Source: Public Records
Tax History Compared to Growth
Tax History
| Year | Tax Paid | Tax Assessment Tax Assessment Total Assessment is a certain percentage of the fair market value that is determined by local assessors to be the total taxable value of land and additions on the property. | Land | Improvement |
|---|---|---|---|---|
| 2025 | $9,685 | $222,900 | $155,820 | $67,080 |
| 2024 | $9,685 | $222,900 | $155,820 | $67,080 |
| 2023 | $9,685 | $222,900 | $155,820 | $67,080 |
| 2022 | $9,685 | $222,900 | $155,820 | $67,080 |
| 2021 | $9,685 | $222,900 | $155,820 | $67,080 |
| 2020 | $9,890 | $183,190 | $127,860 | $55,330 |
| 2019 | $9,890 | $183,190 | $127,860 | $55,330 |
| 2018 | $9,960 | $183,190 | $127,860 | $55,330 |
| 2017 | $10,017 | $184,230 | $127,860 | $56,370 |
| 2016 | $10,017 | $184,230 | $127,860 | $56,370 |
| 2015 | $7,829 | $185,520 | $111,860 | $73,660 |
| 2014 | $7,829 | $185,520 | $111,860 | $73,660 |
Source: Public Records
Map
Nearby Homes
- 105 Fox St Unit 107
- 165 Bennett St
- 39 Jetland Place Unit 41
- 554 Brewster St Unit 4
- 855 Brewster St Unit 857
- 75 Homestead Ave Unit 77
- 361 Riverside Dr
- 26 Rowsley St Unit 3
- 37 Rowsley St Unit 6
- 166 Alfred St
- 317 Brewster St
- 2180 Kings Hwy Unit 1
- 167 Scofield Ave
- 0 Battery Park Dr
- 188 Monroe St Unit 190
- 82 Waldorf Ave
- 38 Edge Hill Rd
- 15 Barton Rd
- 96 Clinton St
- 274 High St
- 48 Newton St Unit 3rd F
- 48 Newton St Unit 3rd Flr
- 46 Newton St Unit 2nd F
- 44 Newton St Unit 46
- 22 Newton St Unit 26
- 639 Courtland Ave
- 55 Montgomery St
- 645 Courtland Ave
- 631 Courtland Ave
- 36 Livingston St
- 73 Montgomery St Unit 75
- 73-75 Montgomery St
- 661 Courtland Ave
- 27 Newton St
- 77 Montgomery St
- 619 Courtland Ave
- 671 Courtland Ave
- 607 Courtland Ave Unit 609
- 18 Montgomery St Unit 3
- 24 Montgomery St