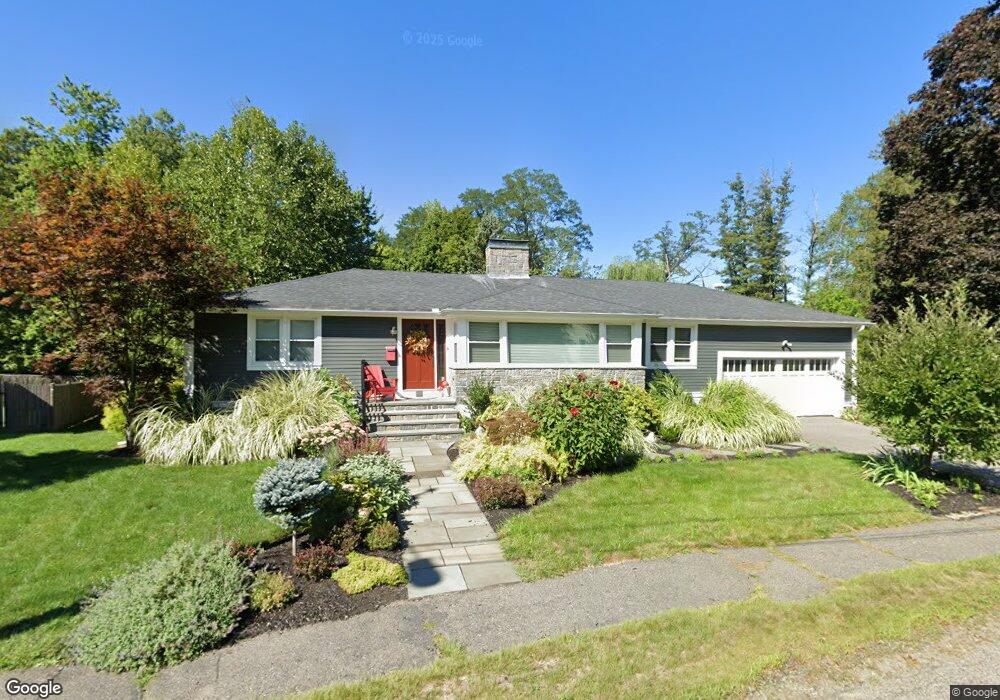
36 Oakley Ln Waltham, MA 02452
Bentley College NeighborhoodEstimated Value: $907,000 - $1,161,000
2
Beds
4
Baths
2,482
Sq Ft
$404/Sq Ft
Est. Value
About This Home
This home is located at 36 Oakley Ln, Waltham, MA 02452 and is currently estimated at $1,001,592, approximately $403 per square foot. 36 Oakley Ln is a home located in Middlesex County with nearby schools including Thomas R Plympton Elementary School, John F Kennedy Middle School, and Waltham Sr High School.
Ownership History
Date
Name
Owned For
Owner Type
Purchase Details
Closed on
Feb 21, 2007
Sold by
36 Oakley Lane T
Bought by
Quattrini Elissa
Current Estimated Value
Home Financials for this Owner
Home Financials are based on the most recent Mortgage that was taken out on this home.
Original Mortgage
$379,472
Interest Rate
6.23%
Mortgage Type
Purchase Money Mortgage
Purchase Details
Closed on
Dec 20, 2006
Sold by
Mooney Rt
Bought by
36 Oakley Lane T
Home Financials for this Owner
Home Financials are based on the most recent Mortgage that was taken out on this home.
Original Mortgage
$1
Interest Rate
6.35%
Mortgage Type
Purchase Money Mortgage
Create a Home Valuation Report for This Property
The Home Valuation Report is an in-depth analysis detailing your home's value as well as a comparison with similar homes in the area
Home Values in the Area
Average Home Value in this Area
Purchase History
| Date | Buyer | Sale Price | Title Company |
|---|---|---|---|
| Quattrini Elissa | $474,340 | -- | |
| 36 Oakley Lane T | $270,000 | -- | |
| Quattrini Elissa | $474,340 | -- | |
| 36 Oakley Lane T | $270,000 | -- |
Source: Public Records
Mortgage History
| Date | Status | Borrower | Loan Amount |
|---|---|---|---|
| Open | 36 Oakley Lane T | $376,550 | |
| Closed | Quattrini Elissa | $379,472 | |
| Previous Owner | 36 Oakley Lane T | $1 |
Source: Public Records
Tax History Compared to Growth
Tax History
| Year | Tax Paid | Tax Assessment Tax Assessment Total Assessment is a certain percentage of the fair market value that is determined by local assessors to be the total taxable value of land and additions on the property. | Land | Improvement |
|---|---|---|---|---|
| 2025 | $7,733 | $787,500 | $525,900 | $261,600 |
| 2024 | $7,308 | $758,100 | $501,300 | $256,800 |
| 2023 | $7,213 | $698,900 | $455,700 | $243,200 |
| 2022 | $7,286 | $654,000 | $419,300 | $234,700 |
| 2021 | $12,934 | $618,400 | $401,000 | $217,400 |
| 2020 | $6,642 | $555,800 | $373,700 | $182,100 |
| 2019 | $0 | $529,300 | $369,100 | $160,200 |
| 2018 | $0 | $485,600 | $341,800 | $143,800 |
| 2017 | $0 | $478,300 | $309,900 | $168,400 |
| 2016 | $5,464 | $446,400 | $278,000 | $168,400 |
| 2015 | $5,684 | $432,900 | $273,400 | $159,500 |
Source: Public Records
Map
Nearby Homes
- 214 Church St
- 70 School St
- 160 School St Unit 3-1
- 326 Bacon St
- 501 Lexington St Unit 11
- 7-11.5 Felton
- 511 Lexington St
- 49 Lincoln St
- 15 Howard St
- 37 Summit St
- 32 Harvard St Unit 2
- 34 Cedar Hill Ln
- 91 Prentice St
- 266 Linden St
- 43-45 Welligton Unit 3
- 14 Willard St
- 266-274 River St
- 55-57 Crescent St
- 16 Winter St Unit 26C
- 59 Farnum Rd
- 46 Oakley Ln
- 30 Oakley Ln
- 41 Oakley Ln
- 21 Oakley Ln
- 54 Oakley Ln
- 20 Oakley Ln
- 35 Valley View Rd
- 53 Oakley Ln
- 29 Valley View Rd
- 14 Oakley Ln
- 61 Oakley Ln
- 6 Oakley Ln
- 23 Valley View Rd
- 62 Oakley Ln
- 62 Oakley Ln Unit 1
- 30 Valley View Rd
- 48 Valley View Rd
- 71 Oakley Ln
- 55 Valley View Rd
- 11 Valley View Rd