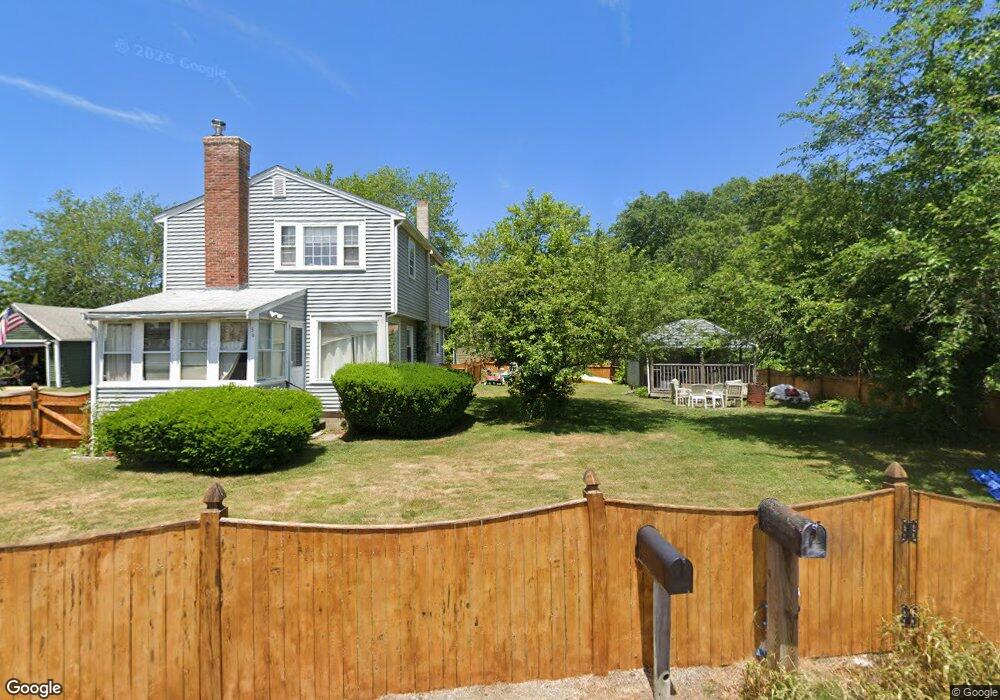
36 Ocean Ave Monponsett, MA 02350
Estimated Value: $342,000 - $424,000
2
Beds
1
Bath
740
Sq Ft
$519/Sq Ft
Est. Value
About This Home
This home is located at 36 Ocean Ave, Monponsett, MA 02350 and is currently estimated at $384,336, approximately $519 per square foot. 36 Ocean Ave is a home located in Plymouth County.
Ownership History
Date
Name
Owned For
Owner Type
Purchase Details
Closed on
May 17, 2022
Sold by
Runey Paul F Est
Bought by
Hurst Bradford R
Current Estimated Value
Purchase Details
Closed on
Jul 16, 2021
Sold by
Paul F Runey T
Bought by
Hurst Bradford R
Home Financials for this Owner
Home Financials are based on the most recent Mortgage that was taken out on this home.
Original Mortgage
$274,550
Interest Rate
2.9%
Mortgage Type
Purchase Money Mortgage
Purchase Details
Closed on
Jul 22, 2019
Sold by
Runey Paul F
Bought by
Paul F Runey T
Create a Home Valuation Report for This Property
The Home Valuation Report is an in-depth analysis detailing your home's value as well as a comparison with similar homes in the area
Home Values in the Area
Average Home Value in this Area
Purchase History
| Date | Buyer | Sale Price | Title Company |
|---|---|---|---|
| Hurst Bradford R | -- | None Available | |
| Hurst Bradford R | $289,000 | None Available | |
| Paul F Runey T | -- | None Available |
Source: Public Records
Mortgage History
| Date | Status | Borrower | Loan Amount |
|---|---|---|---|
| Previous Owner | Hurst Bradford R | $274,550 |
Source: Public Records
Tax History
| Year | Tax Paid | Tax Assessment Tax Assessment Total Assessment is a certain percentage of the fair market value that is determined by local assessors to be the total taxable value of land and additions on the property. | Land | Improvement |
|---|---|---|---|---|
| 2025 | $3,857 | $288,300 | $107,700 | $180,600 |
| 2024 | $3,746 | $280,000 | $104,600 | $175,400 |
| 2023 | $3,649 | $257,300 | $104,600 | $152,700 |
| 2022 | $3,504 | $232,200 | $95,100 | $137,100 |
| 2021 | $2,217 | $146,800 | $82,300 | $64,500 |
| 2020 | $2,185 | $143,100 | $79,500 | $63,600 |
| 2019 | $2,053 | $132,200 | $73,100 | $59,100 |
| 2018 | $2,031 | $128,300 | $70,300 | $58,000 |
| 2017 | $1,900 | $118,900 | $62,500 | $56,400 |
| 2016 | $1,945 | $117,500 | $62,500 | $55,000 |
| 2015 | $1,853 | $116,400 | $62,500 | $53,900 |
Source: Public Records
Map
Nearby Homes
- 0 Union Park St
- 115 Waltham St
- 102 Leon Ct
- 553 Monponsett St
- 1 Poplar Rd
- 0 Thompson St
- 37 Annawon Dr
- 318 South St
- 25 Lawrence Rd
- 102 Twin Lakes Dr
- 143 Plymouth St
- 343 Monponsett St
- 151 Plymouth St Unit 151A
- 265 Monponsett St Unit 2210
- 265 Monponsett St Unit 2203
- 266 Monponsett St Unit 1103
- 266 Monponsett St Unit 1105
- 266 Monponsett St Unit 1201
- 266 Monponsett St Unit 1208
- 266 Monponsett St Unit 1108
Your Personal Tour Guide
Ask me questions while you tour the home.