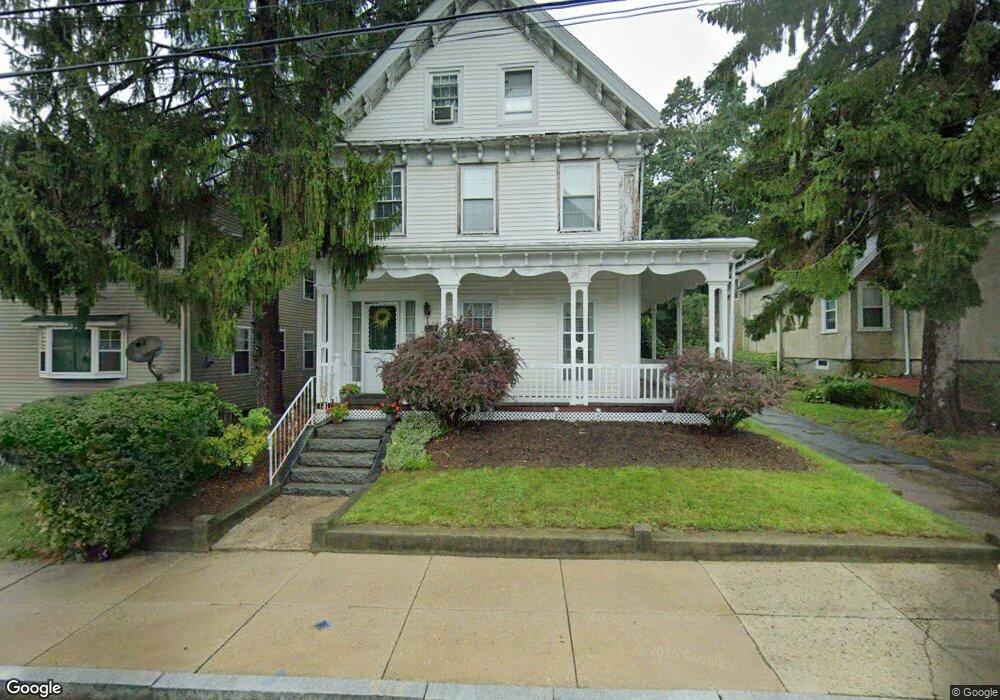
36 Old Morton St Mattapan, MA 02126
West Codman Hill-West Lowe NeighborhoodEstimated Value: $770,000 - $812,063
4
Beds
2
Baths
2,485
Sq Ft
$316/Sq Ft
Est. Value
About This Home
This home is located at 36 Old Morton St, Mattapan, MA 02126 and is currently estimated at $784,266, approximately $315 per square foot. 36 Old Morton St is a home located in Suffolk County with nearby schools including Conservatory Lab Upper School, Saint John Paul II Catholic Academy, and Epiphany School.
Ownership History
Date
Name
Owned For
Owner Type
Purchase Details
Closed on
Sep 23, 2022
Sold by
Rue Marcia A
Bought by
Rue Rt
Current Estimated Value
Purchase Details
Closed on
Nov 20, 1996
Sold by
Aylward Fabian F
Bought by
Rue Marcia A and Rue Scott E
Home Financials for this Owner
Home Financials are based on the most recent Mortgage that was taken out on this home.
Original Mortgage
$112,868
Interest Rate
7.81%
Mortgage Type
Purchase Money Mortgage
Create a Home Valuation Report for This Property
The Home Valuation Report is an in-depth analysis detailing your home's value as well as a comparison with similar homes in the area
Home Values in the Area
Average Home Value in this Area
Purchase History
| Date | Buyer | Sale Price | Title Company |
|---|---|---|---|
| Rue Rt | -- | None Available | |
| Rue Marcia A | $93,000 | -- |
Source: Public Records
Mortgage History
| Date | Status | Borrower | Loan Amount |
|---|---|---|---|
| Previous Owner | Rue Marcia A | $112,868 |
Source: Public Records
Tax History Compared to Growth
Tax History
| Year | Tax Paid | Tax Assessment Tax Assessment Total Assessment is a certain percentage of the fair market value that is determined by local assessors to be the total taxable value of land and additions on the property. | Land | Improvement |
|---|---|---|---|---|
| 2025 | $7,657 | $661,200 | $216,500 | $444,700 |
| 2024 | $7,918 | $726,400 | $197,400 | $529,000 |
| 2023 | $7,504 | $698,700 | $189,900 | $508,800 |
| 2022 | $7,038 | $646,900 | $175,800 | $471,100 |
| 2021 | $6,785 | $635,900 | $175,800 | $460,100 |
| 2020 | $5,990 | $567,200 | $179,800 | $387,400 |
| 2019 | $5,536 | $525,200 | $138,500 | $386,700 |
| 2018 | $5,243 | $500,300 | $138,500 | $361,800 |
| 2017 | $4,997 | $471,900 | $138,500 | $333,400 |
| 2016 | $4,807 | $437,000 | $138,500 | $298,500 |
| 2015 | $4,579 | $378,100 | $117,800 | $260,300 |
| 2014 | $4,441 | $353,000 | $117,800 | $235,200 |
Source: Public Records
Map
Nearby Homes
- 32-32R Temple St
- 8-14R Temple St
- 1245 Adams St Unit B406
- 1245 Adams St Unit B210
- 21A High St Unit 2
- 131 Eliot St Unit 312
- 131 Eliot St Unit 408
- 131 Eliot St Unit 305
- 67 Idaho St
- 30 Pleasant Hill Ave Unit 32
- 36 Oakridge St
- 14 Valley Rd
- 22 Branchfield St Unit D4
- 4 School St
- 84-86 Codman Hill Ave
- 23 Maryknoll St
- 2089 Dorchester Ave Unit 1
- 2089 Dorchester Ave Unit 2
- 13 Patterson St
- 56 Fairmount St Unit 2
- 32 Old Morton St
- 40 Old Morton St
- 44 Old Morton St
- 44 Old Morton St Unit 1
- 44 Old Morton St Unit 3
- 28 Old Morton St
- 21 Tanglewood Rd Unit 2
- 21 Tanglewood Rd Unit 1
- 48 Old Morton St
- 24 Old Morton St
- 24 Old Morton St
- 50R Old Morton St
- 39 Old Morton St Unit 2
- 37 Old Morton St
- 37 Old Morton St Unit 2
- 39 Old Morton St Unit 1
- 37 Old Morton St Unit 1
- 41 Old Morton St
- 41 Old Morton St Unit Right
- 43 Old Morton St