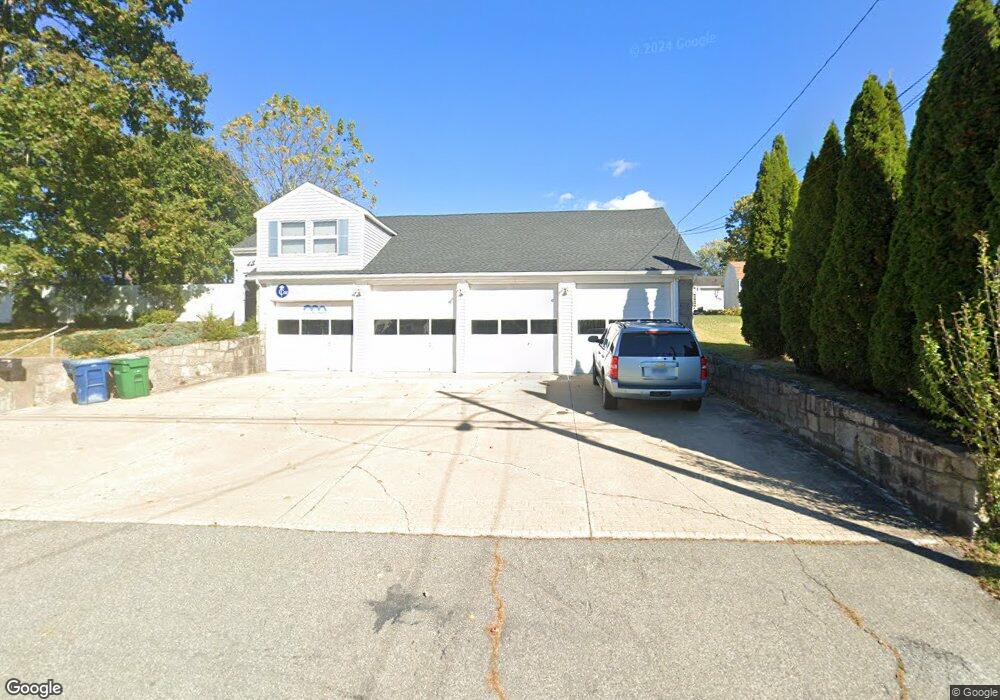
36 Olive St Waterford, CT 06385
Estimated Value: $412,198
1
Bed
1
Bath
2,279
Sq Ft
$181/Sq Ft
Est. Value
About This Home
This home is located at 36 Olive St, Waterford, CT 06385 and is currently estimated at $412,198, approximately $180 per square foot. 36 Olive St is a home located in New London County with nearby schools including Clark Lane Middle School, Waterford High School, and New London High School Multi-Magnet Campus.
Ownership History
Date
Name
Owned For
Owner Type
Purchase Details
Closed on
Sep 16, 2024
Sold by
Cormier Richard N
Bought by
Cormier T T and Cormier C
Current Estimated Value
Purchase Details
Closed on
Oct 29, 2020
Sold by
Olive St Associates Llc
Bought by
Cormier Richard N
Home Financials for this Owner
Home Financials are based on the most recent Mortgage that was taken out on this home.
Original Mortgage
$190,000
Interest Rate
2.8%
Mortgage Type
Balloon
Purchase Details
Closed on
Feb 14, 2000
Sold by
Mazzella Charles A and Mazzella Deborah A
Bought by
Olive Street Assoc
Create a Home Valuation Report for This Property
The Home Valuation Report is an in-depth analysis detailing your home's value as well as a comparison with similar homes in the area
Home Values in the Area
Average Home Value in this Area
Purchase History
| Date | Buyer | Sale Price | Title Company |
|---|---|---|---|
| Cormier T T | -- | None Available | |
| Cormier Richard N | -- | None Available | |
| Cormier Richard N | -- | None Available | |
| Olive Street Assoc | $130,000 | -- | |
| Olive Street Assoc | $130,000 | -- |
Source: Public Records
Mortgage History
| Date | Status | Borrower | Loan Amount |
|---|---|---|---|
| Previous Owner | Cormier Richard N | $190,000 | |
| Previous Owner | Olive Street Assoc | $150,000 | |
| Previous Owner | Olive Street Assoc | $150,000 |
Source: Public Records
Tax History Compared to Growth
Tax History
| Year | Tax Paid | Tax Assessment Tax Assessment Total Assessment is a certain percentage of the fair market value that is determined by local assessors to be the total taxable value of land and additions on the property. | Land | Improvement |
|---|---|---|---|---|
| 2025 | $3,979 | $170,330 | $62,310 | $108,020 |
| 2024 | $3,798 | $170,330 | $62,310 | $108,020 |
| 2023 | $3,611 | $170,330 | $62,310 | $108,020 |
| 2022 | $4,480 | $162,540 | $45,700 | $116,840 |
| 2021 | $4,493 | $162,540 | $45,700 | $116,840 |
| 2020 | $4,530 | $162,540 | $45,700 | $116,840 |
| 2019 | $4,548 | $162,540 | $45,700 | $116,840 |
| 2018 | $4,457 | $162,540 | $45,700 | $116,840 |
| 2017 | $3,953 | $146,250 | $48,380 | $97,870 |
| 2016 | $3,917 | $146,250 | $48,380 | $97,870 |
| 2015 | $3,778 | $146,250 | $48,380 | $97,870 |
| 2014 | $3,778 | $146,250 | $48,380 | $97,870 |
Source: Public Records
Map
Nearby Homes
- 68 Clark Ln
- 213 Boston Post Rd
- 54 Rope Ferry Rd Unit C55
- 54 Rope Ferry Rd Unit D72
- 54 Rope Ferry Rd Unit C45
- 24 Pine St
- 35 Pine St
- 12 Pine St
- 2 Faye St
- 5 Windy Ridge Place Unit 5
- 34 Ivy Hill Rd
- 7 Ivy Hill Rd
- 26 Ivy Hill Rd
- 270 Boston Post Rd Unit 22
- 270 Boston Post Rd Unit TRLR 6
- 77 Colman St
- 18 W Pleasant St
- 152 Blydenburg Ave
- 835 Bank St
- 26 Jefferson Ave