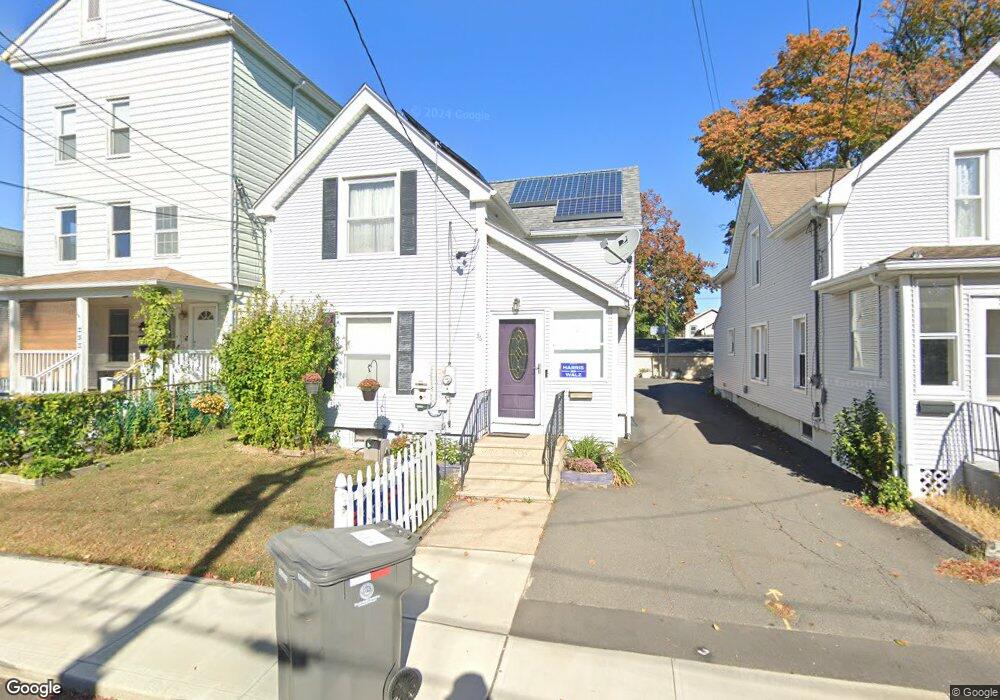
36 Orchard St Bristol, CT 06010
Downtown Bristol NeighborhoodEstimated Value: $277,000 - $285,000
3
Beds
2
Baths
1,356
Sq Ft
$207/Sq Ft
Est. Value
About This Home
This home is located at 36 Orchard St, Bristol, CT 06010 and is currently estimated at $280,298, approximately $206 per square foot. 36 Orchard St is a home located in Hartford County with nearby schools including West Bristol Sch, Bristol Central High School, and Immanuel Lutheran School.
Ownership History
Date
Name
Owned For
Owner Type
Purchase Details
Closed on
Jun 30, 2000
Sold by
Maycock Michael T and Maycock Dareen Lb
Bought by
Cintron Esther M and Castro Maria
Current Estimated Value
Home Financials for this Owner
Home Financials are based on the most recent Mortgage that was taken out on this home.
Original Mortgage
$96,100
Interest Rate
8.59%
Purchase Details
Closed on
Sep 22, 1998
Sold by
Lafrance Corinne M
Bought by
Magcock Michael T and Magcock Dorren L
Home Financials for this Owner
Home Financials are based on the most recent Mortgage that was taken out on this home.
Original Mortgage
$84,458
Interest Rate
6.9%
Mortgage Type
Unknown
Create a Home Valuation Report for This Property
The Home Valuation Report is an in-depth analysis detailing your home's value as well as a comparison with similar homes in the area
Home Values in the Area
Average Home Value in this Area
Purchase History
| Date | Buyer | Sale Price | Title Company |
|---|---|---|---|
| Cintron Esther M | $97,000 | -- | |
| Magcock Michael T | $86,500 | -- |
Source: Public Records
Mortgage History
| Date | Status | Borrower | Loan Amount |
|---|---|---|---|
| Open | Magcock Michael T | $148,499 | |
| Closed | Magcock Michael T | $95,500 | |
| Closed | Magcock Michael T | $96,100 | |
| Previous Owner | Magcock Michael T | $84,458 |
Source: Public Records
Tax History Compared to Growth
Tax History
| Year | Tax Paid | Tax Assessment Tax Assessment Total Assessment is a certain percentage of the fair market value that is determined by local assessors to be the total taxable value of land and additions on the property. | Land | Improvement |
|---|---|---|---|---|
| 2025 | $4,801 | $142,240 | $24,920 | $117,320 |
| 2024 | $4,530 | $142,240 | $24,920 | $117,320 |
| 2023 | $4,317 | $142,240 | $24,920 | $117,320 |
| 2022 | $3,576 | $93,240 | $14,140 | $79,100 |
| 2021 | $3,576 | $93,240 | $14,140 | $79,100 |
| 2020 | $3,576 | $93,240 | $14,140 | $79,100 |
| 2019 | $3,548 | $93,240 | $14,140 | $79,100 |
| 2018 | $3,439 | $93,240 | $14,140 | $79,100 |
| 2017 | $3,458 | $95,970 | $27,020 | $68,950 |
| 2016 | $3,458 | $95,970 | $27,020 | $68,950 |
| 2015 | $3,322 | $95,970 | $27,020 | $68,950 |
| 2014 | $3,322 | $95,970 | $27,020 | $68,950 |
Source: Public Records
Map
Nearby Homes
- 44 Orchard St
- 40 Orchard St Unit 2
- 40 Orchard St Unit 3
- 40 Orchard St Unit 1
- 30 Orchard St
- 33 Orchard St Unit 4
- 33 Orchard St Unit 3
- 33 Orchard St
- 147 School St
- 45 Orchard St
- 137 School St Unit 135 school street
- 137 School St
- 6 Orchard St
- 32 Orchard St
- 6 Orchard St
- 12 Orchard St
- 138 West St
- 110 West St Unit 3
- 110 West St