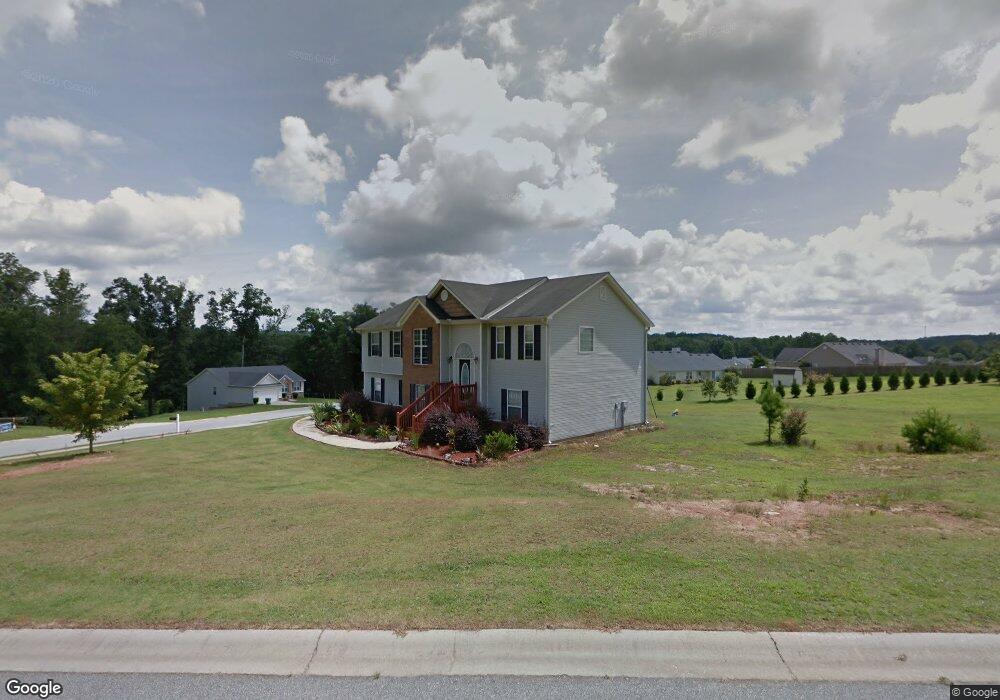
36 Persimmon Dr Jefferson, GA 30549
Estimated Value: $333,000 - $408,000
4
Beds
3
Baths
1,837
Sq Ft
$198/Sq Ft
Est. Value
About This Home
This home is located at 36 Persimmon Dr, Jefferson, GA 30549 and is currently estimated at $363,996, approximately $198 per square foot. 36 Persimmon Dr is a home located in Jackson County with nearby schools including Jefferson Elementary School, Jefferson Academy, and Jefferson Middle School.
Ownership History
Date
Name
Owned For
Owner Type
Purchase Details
Closed on
Feb 18, 2022
Sold by
Charles Alex
Bought by
Charles Alex and Charles Yoldie
Current Estimated Value
Home Financials for this Owner
Home Financials are based on the most recent Mortgage that was taken out on this home.
Original Mortgage
$210,000
Outstanding Balance
$193,494
Interest Rate
3.69%
Mortgage Type
Cash
Estimated Equity
$170,502
Purchase Details
Closed on
Jan 6, 2005
Sold by
Rpm Home Builders Llc
Bought by
Richie Yoldie
Home Financials for this Owner
Home Financials are based on the most recent Mortgage that was taken out on this home.
Original Mortgage
$22,800
Interest Rate
5.61%
Mortgage Type
New Conventional
Purchase Details
Closed on
Aug 18, 2004
Sold by
Galaxy Dev Llc
Bought by
Rpm Home Builders Llc
Create a Home Valuation Report for This Property
The Home Valuation Report is an in-depth analysis detailing your home's value as well as a comparison with similar homes in the area
Home Values in the Area
Average Home Value in this Area
Purchase History
| Date | Buyer | Sale Price | Title Company |
|---|---|---|---|
| Charles Alex | -- | -- | |
| Richie Yoldie | $151,900 | -- | |
| Richie Yoldie | $151,900 | -- | |
| Rpm Home Builders Llc | $760,000 | -- |
Source: Public Records
Mortgage History
| Date | Status | Borrower | Loan Amount |
|---|---|---|---|
| Open | Charles Alex | $210,000 | |
| Previous Owner | Richie Yoldie | $22,800 | |
| Previous Owner | Richie Yoldie | $121,500 |
Source: Public Records
Tax History
| Year | Tax Paid | Tax Assessment Tax Assessment Total Assessment is a certain percentage of the fair market value that is determined by local assessors to be the total taxable value of land and additions on the property. | Land | Improvement |
|---|---|---|---|---|
| 2024 | $3,018 | $110,440 | $25,000 | $85,440 |
| 2023 | $3,030 | $101,320 | $25,000 | $76,320 |
| 2022 | $2,690 | $84,240 | $25,000 | $59,240 |
| 2021 | $2,509 | $77,240 | $18,000 | $59,240 |
| 2020 | $2,326 | $67,000 | $18,000 | $49,000 |
| 2019 | $2,191 | $62,200 | $13,200 | $49,000 |
| 2018 | $2,120 | $59,760 | $13,200 | $46,560 |
| 2017 | $2,022 | $55,884 | $13,200 | $42,684 |
| 2016 | $2,031 | $55,884 | $13,200 | $42,684 |
| 2015 | $1,936 | $53,084 | $10,400 | $42,684 |
| 2014 | $1,508 | $41,091 | $10,400 | $30,691 |
| 2013 | -- | $41,090 | $10,400 | $30,690 |
Source: Public Records
Map
Nearby Homes
- 345 Hickory Hills Dr
- 273 Hickory Hills Dr
- 249 Forest St
- 1681 Jett Roberts Rd
- 66 Highland Dr
- 955 Georgia 82 N
- 194 Georgia 82 N
- Tract 1 Georgia 82 N
- 222 Jett Roberts Rd
- 1362 Washington St
- 470 Katherine Dr
- 445 Katherine Dr
- 185 Jimmy Reynolds Dr
- 41 Melivy Ct
- 865 Elder Dr
- 567 Storey Ln
- 206 Blue Dragon Dr
- 53 Adventure Trail
- 406 Hidden Lakes Trail
- 514 Adventure Trail
- 435 Silver Bell Rd
- 78 Persimmon Dr
- 25 Persimmon Dr
- 65 Persimmon Dr
- 24 Holly Ct
- 384 Silver Bell Rd
- 116 Persimmon Dr
- 471 Silver Bell Rd
- 352 Silver Bell Rd
- 105 Persimmon Dr
- 38 Holly Ct
- 38 Holly Ct Unit 50
- 325 Silver Bell Rd
- 325 Silver Bell Rd Unit Lot 11
- 142 Persimmon Dr
- 336 Silver Bell Rd
- 129 Persimmon Dr
- 27 Holly Ct
- 507 Silver Bell Rd
- 486 Silver Bell Rd
Your Personal Tour Guide
Ask me questions while you tour the home.