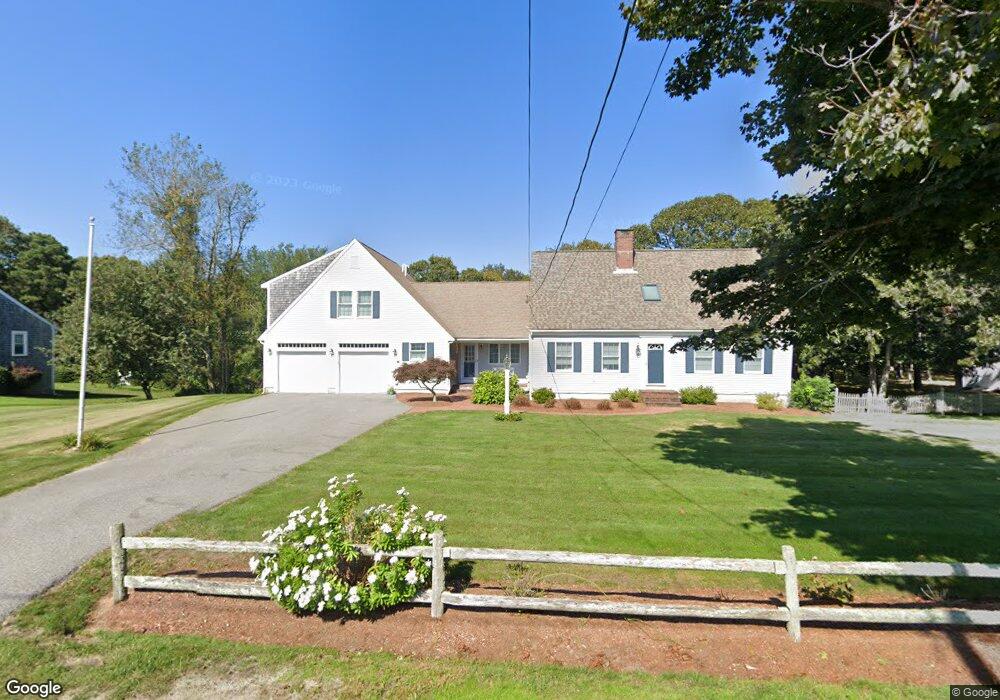
36 Pleasant St West Dennis, MA 2670
West Dennis NeighborhoodEstimated Value: $944,000 - $1,756,000
6
Beds
5
Baths
3,458
Sq Ft
$408/Sq Ft
Est. Value
About This Home
This home is located at 36 Pleasant St, West Dennis, MA 2670 and is currently estimated at $1,410,208, approximately $407 per square foot. 36 Pleasant St is a home located in Barnstable County with nearby schools including Dennis-Yarmouth Regional High School and St. Pius X. School.
Ownership History
Date
Name
Owned For
Owner Type
Purchase Details
Closed on
Feb 23, 2015
Sold by
Downey Anne F
Bought by
Anne F Downey Ret
Current Estimated Value
Purchase Details
Closed on
Jan 29, 1990
Sold by
Ferro Ronald C
Bought by
Modiano Albert L
Create a Home Valuation Report for This Property
The Home Valuation Report is an in-depth analysis detailing your home's value as well as a comparison with similar homes in the area
Home Values in the Area
Average Home Value in this Area
Purchase History
| Date | Buyer | Sale Price | Title Company |
|---|---|---|---|
| Anne F Downey Ret | -- | -- | |
| Modiano Albert L | $117,000 | -- |
Source: Public Records
Mortgage History
| Date | Status | Borrower | Loan Amount |
|---|---|---|---|
| Previous Owner | Modiano Albert L | $265,750 | |
| Previous Owner | Modiano Albert L | $140,000 | |
| Previous Owner | Modiano Albert L | $160,000 |
Source: Public Records
Tax History Compared to Growth
Tax History
| Year | Tax Paid | Tax Assessment Tax Assessment Total Assessment is a certain percentage of the fair market value that is determined by local assessors to be the total taxable value of land and additions on the property. | Land | Improvement |
|---|---|---|---|---|
| 2025 | $6,157 | $1,421,900 | $240,900 | $1,181,000 |
| 2024 | $6,153 | $1,401,700 | $231,700 | $1,170,000 |
| 2023 | $5,951 | $1,274,400 | $210,600 | $1,063,800 |
| 2022 | $5,654 | $1,009,600 | $208,700 | $800,900 |
| 2021 | $5,413 | $897,700 | $204,600 | $693,100 |
| 2020 | $5,389 | $883,500 | $223,200 | $660,300 |
| 2019 | $4,177 | $677,000 | $182,400 | $494,600 |
| 2018 | $4,683 | $738,600 | $260,400 | $478,200 |
| 2017 | $4,222 | $686,500 | $208,300 | $478,200 |
| 2016 | $4,193 | $642,100 | $234,400 | $407,700 |
| 2015 | $4,109 | $642,100 | $234,400 | $407,700 |
| 2014 | $3,996 | $629,300 | $234,400 | $394,900 |
Source: Public Records
Map
Nearby Homes
- 178 School St
- 14 Schoolhouse Ln
- 23 Doric Ave
- 209 Main St Unit 3
- 209 Main St Unit 6
- 209 Main St Unit 1
- 209 Main St Unit 2
- 209 Main St Unit 4
- 209 Main St Unit 5
- 401 Main St Unit 201
- 401 Main St Unit 101
- 2 Rita Mary Way
- 467 Main St
- 428 Main St Unit 1-11
- 61 Trotters Ln
- 6 Baker Way
- 27 Mayflower Ln
- 45 Seth Ln
- 308 Old Main St
- 40 Kelley Rd