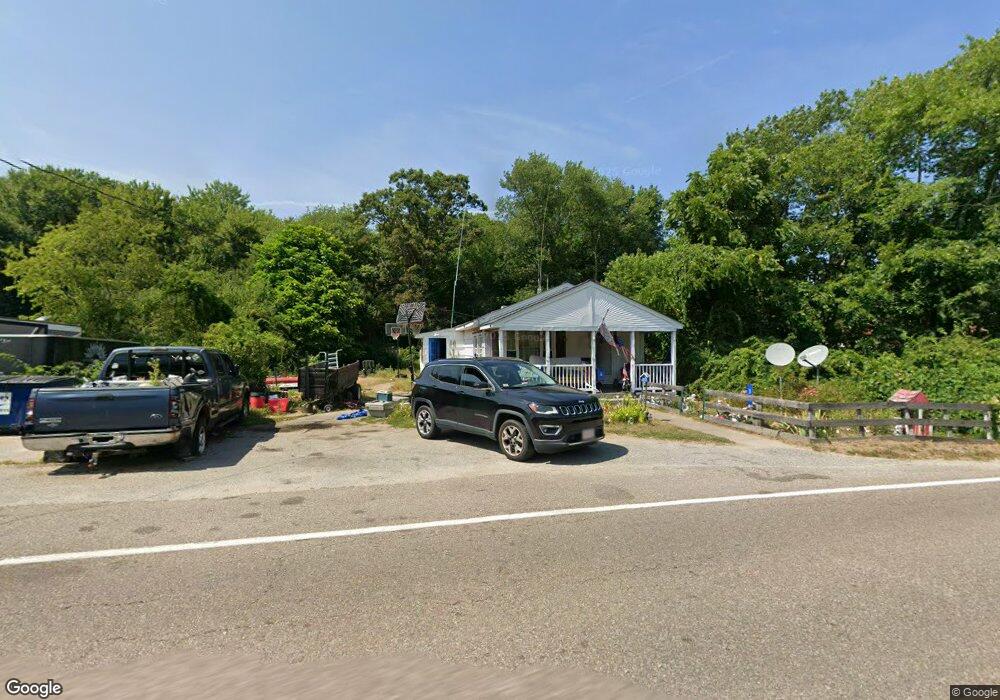
36 Porter St Unit 1 Berkley, MA 02779
Estimated Value: $335,000 - $452,000
3
Beds
1
Bath
900
Sq Ft
$451/Sq Ft
Est. Value
About This Home
This home is located at 36 Porter St Unit 1, Berkley, MA 02779 and is currently estimated at $405,834, approximately $450 per square foot. 36 Porter St Unit 1 is a home located in Bristol County with nearby schools including Berkley Community School and Our Lady of Lourdes School.
Ownership History
Date
Name
Owned For
Owner Type
Purchase Details
Closed on
Dec 9, 2015
Sold by
Adams Timothy E
Bought by
Nye Michael and Nye Donna
Current Estimated Value
Home Financials for this Owner
Home Financials are based on the most recent Mortgage that was taken out on this home.
Original Mortgage
$179,685
Outstanding Balance
$143,406
Interest Rate
3.75%
Mortgage Type
FHA
Estimated Equity
$262,428
Purchase Details
Closed on
Dec 22, 2005
Sold by
Rose Angelina
Bought by
Adams Timothy E
Create a Home Valuation Report for This Property
The Home Valuation Report is an in-depth analysis detailing your home's value as well as a comparison with similar homes in the area
Home Values in the Area
Average Home Value in this Area
Purchase History
| Date | Buyer | Sale Price | Title Company |
|---|---|---|---|
| Nye Michael | $183,000 | -- | |
| Adams Timothy E | $110,000 | -- |
Source: Public Records
Mortgage History
| Date | Status | Borrower | Loan Amount |
|---|---|---|---|
| Open | Nye Michael | $179,685 |
Source: Public Records
Tax History Compared to Growth
Tax History
| Year | Tax Paid | Tax Assessment Tax Assessment Total Assessment is a certain percentage of the fair market value that is determined by local assessors to be the total taxable value of land and additions on the property. | Land | Improvement |
|---|---|---|---|---|
| 2025 | $35 | $289,500 | $118,300 | $171,200 |
| 2024 | $3,327 | $267,200 | $101,900 | $165,300 |
| 2023 | $3,302 | $249,800 | $101,900 | $147,900 |
| 2022 | $3,185 | $231,600 | $88,600 | $143,000 |
| 2021 | $8,762 | $217,300 | $84,400 | $132,900 |
| 2020 | $8,094 | $206,000 | $74,600 | $131,400 |
| 2019 | $8,212 | $199,600 | $74,600 | $125,000 |
| 2018 | $2,679 | $191,100 | $71,700 | $119,400 |
| 2017 | $8,468 | $186,500 | $80,400 | $106,100 |
| 2016 | $2,529 | $170,400 | $80,400 | $90,000 |
| 2015 | $2,540 | $182,600 | $104,100 | $78,500 |
| 2014 | $2,354 | $183,800 | $104,100 | $79,700 |
Source: Public Records
Map
Nearby Homes