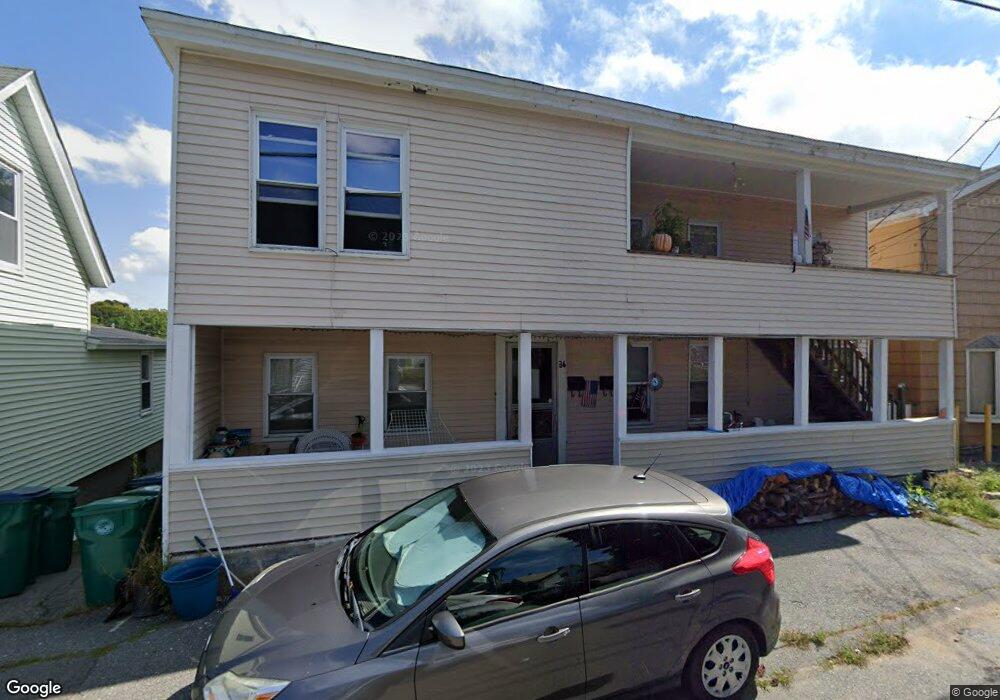
36 Railroad St Fitchburg, MA 01420
Estimated Value: $365,515 - $460,000
4
Beds
2
Baths
1,564
Sq Ft
$255/Sq Ft
Est. Value
About This Home
This home is located at 36 Railroad St, Fitchburg, MA 01420 and is currently estimated at $398,879, approximately $255 per square foot. 36 Railroad St is a home located in Worcester County with nearby schools including South Street Elementary School, Crocker Elementary School, and Reingold Elementary School.
Ownership History
Date
Name
Owned For
Owner Type
Purchase Details
Closed on
Mar 6, 2002
Sold by
Howells Richard L
Bought by
Troxler Edward P and Troxler Maryann
Current Estimated Value
Home Financials for this Owner
Home Financials are based on the most recent Mortgage that was taken out on this home.
Original Mortgage
$66,500
Outstanding Balance
$27,681
Interest Rate
7.01%
Mortgage Type
Purchase Money Mortgage
Estimated Equity
$371,198
Purchase Details
Closed on
Aug 29, 1996
Sold by
Granata Liborio P
Bought by
Howells Richard L
Create a Home Valuation Report for This Property
The Home Valuation Report is an in-depth analysis detailing your home's value as well as a comparison with similar homes in the area
Home Values in the Area
Average Home Value in this Area
Purchase History
| Date | Buyer | Sale Price | Title Company |
|---|---|---|---|
| Troxler Edward P | $70,000 | -- | |
| Howells Richard L | $20,000 | -- |
Source: Public Records
Mortgage History
| Date | Status | Borrower | Loan Amount |
|---|---|---|---|
| Open | Howells Richard L | $66,500 | |
| Previous Owner | Howells Richard L | $56,250 |
Source: Public Records
Tax History Compared to Growth
Tax History
| Year | Tax Paid | Tax Assessment Tax Assessment Total Assessment is a certain percentage of the fair market value that is determined by local assessors to be the total taxable value of land and additions on the property. | Land | Improvement |
|---|---|---|---|---|
| 2025 | $42 | $313,500 | $68,700 | $244,800 |
| 2024 | $3,300 | $222,800 | $41,200 | $181,600 |
| 2023 | $2,996 | $187,000 | $31,600 | $155,400 |
| 2022 | $2,860 | $162,400 | $27,800 | $134,600 |
| 2021 | $2,742 | $144,100 | $23,400 | $120,700 |
| 2020 | $2,127 | $107,900 | $19,200 | $88,700 |
| 2019 | $2,051 | $100,100 | $26,600 | $73,500 |
| 2018 | $1,929 | $91,800 | $24,500 | $67,300 |
| 2017 | $1,749 | $81,400 | $22,400 | $59,000 |
| 2016 | $1,728 | $81,400 | $22,400 | $59,000 |
| 2015 | $1,650 | $79,800 | $23,400 | $56,400 |
| 2014 | $1,582 | $79,800 | $23,400 | $56,400 |
Source: Public Records
Map
Nearby Homes