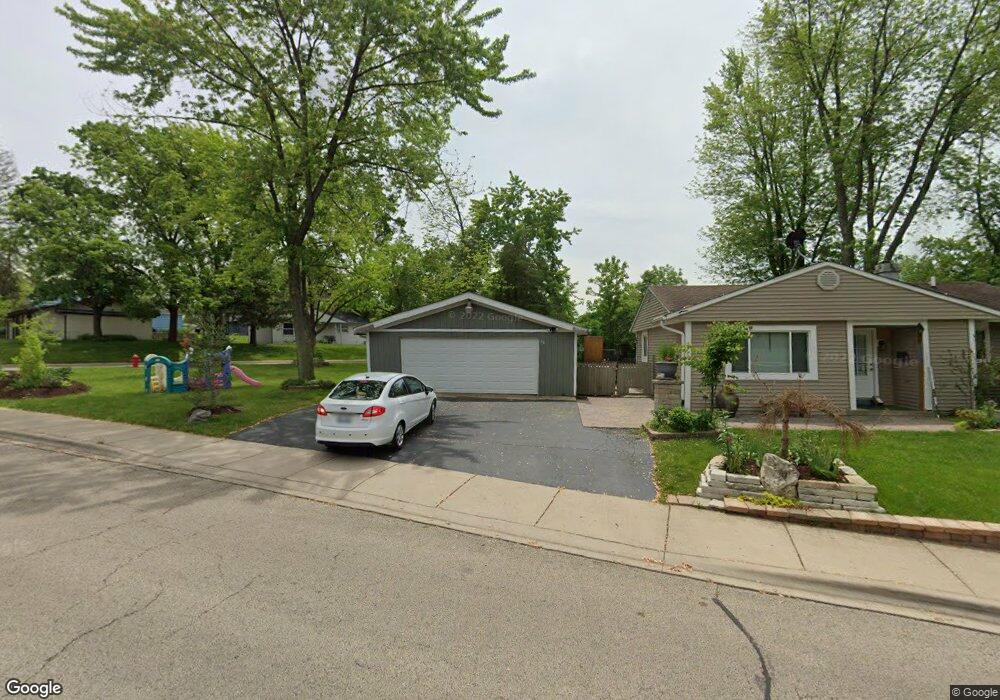
36 Robin Rd Carpentersville, IL 60110
Estimated Value: $214,000 - $277,601
3
Beds
1
Bath
920
Sq Ft
$256/Sq Ft
Est. Value
About This Home
This home is located at 36 Robin Rd, Carpentersville, IL 60110 and is currently estimated at $235,650, approximately $256 per square foot. 36 Robin Rd is a home located in Kane County with nearby schools including Meadowdale Elementary School, Carpentersville Middle School, and Dundee-Crown High School.
Ownership History
Date
Name
Owned For
Owner Type
Purchase Details
Closed on
Jun 16, 2011
Sold by
Secretary Of Housing & Urban Development
Bought by
Garcia Everardo
Current Estimated Value
Purchase Details
Closed on
Aug 23, 2010
Sold by
Swanson Aaron
Bought by
Secretary Of Housing & Urban Development
Purchase Details
Closed on
Aug 22, 2001
Sold by
Bailey Laurence L and Wesemann Cynthia A
Bought by
Swanson Aaron
Home Financials for this Owner
Home Financials are based on the most recent Mortgage that was taken out on this home.
Original Mortgage
$99,419
Interest Rate
7.28%
Mortgage Type
FHA
Create a Home Valuation Report for This Property
The Home Valuation Report is an in-depth analysis detailing your home's value as well as a comparison with similar homes in the area
Home Values in the Area
Average Home Value in this Area
Purchase History
| Date | Buyer | Sale Price | Title Company |
|---|---|---|---|
| Garcia Everardo | -- | Stewart Title Company | |
| Secretary Of Housing & Urban Development | -- | Wheatland Title Guaranty | |
| Swanson Aaron | $101,000 | -- |
Source: Public Records
Mortgage History
| Date | Status | Borrower | Loan Amount |
|---|---|---|---|
| Previous Owner | Swanson Aaron | $99,419 |
Source: Public Records
Tax History Compared to Growth
Tax History
| Year | Tax Paid | Tax Assessment Tax Assessment Total Assessment is a certain percentage of the fair market value that is determined by local assessors to be the total taxable value of land and additions on the property. | Land | Improvement |
|---|---|---|---|---|
| 2024 | $4,932 | $73,121 | $12,553 | $60,568 |
| 2023 | $4,856 | $65,792 | $11,295 | $54,497 |
| 2022 | $4,194 | $54,164 | $11,295 | $42,869 |
| 2021 | $4,089 | $51,142 | $10,665 | $40,477 |
| 2020 | $4,019 | $49,992 | $10,425 | $39,567 |
| 2019 | $3,923 | $47,458 | $9,897 | $37,561 |
| 2018 | $3,732 | $43,601 | $9,701 | $33,900 |
| 2017 | $3,568 | $40,787 | $9,075 | $31,712 |
| 2016 | $3,166 | $35,064 | $8,787 | $26,277 |
| 2015 | -- | $28,111 | $8,234 | $19,877 |
| 2014 | -- | $25,264 | $8,007 | $17,257 |
| 2013 | -- | $26,037 | $8,252 | $17,785 |
Source: Public Records
Map
Nearby Homes