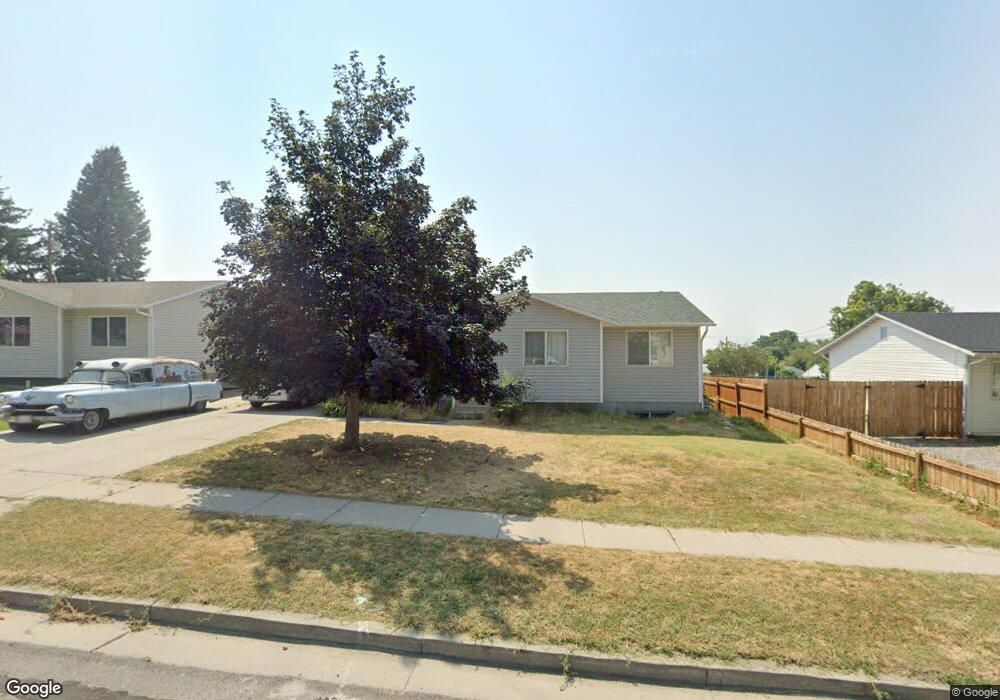
36 S 3rd St Tooele, UT 84074
Estimated Value: $384,000 - $419,966
5
Beds
3
Baths
2,150
Sq Ft
$187/Sq Ft
Est. Value
About This Home
This home is located at 36 S 3rd St, Tooele, UT 84074 and is currently estimated at $401,492, approximately $186 per square foot. 36 S 3rd St is a home located in Tooele County with nearby schools including Sterling Elementary School, Tooele Junior High School, and Tooele High School.
Ownership History
Date
Name
Owned For
Owner Type
Purchase Details
Closed on
Feb 1, 2016
Sold by
Funaki Fe Ofa Aki K and Funaki Lindy A
Bought by
Morgan Michael G and Morgan Julie A I
Current Estimated Value
Home Financials for this Owner
Home Financials are based on the most recent Mortgage that was taken out on this home.
Original Mortgage
$163,496
Outstanding Balance
$130,251
Interest Rate
3.93%
Mortgage Type
New Conventional
Estimated Equity
$271,241
Purchase Details
Closed on
Aug 22, 2006
Sold by
Farnsworth Clifford S and Farnsworth Tressie
Bought by
Funaki Feofaaki K and Funaki Lindy A
Home Financials for this Owner
Home Financials are based on the most recent Mortgage that was taken out on this home.
Original Mortgage
$136,000
Interest Rate
6.7%
Mortgage Type
New Conventional
Create a Home Valuation Report for This Property
The Home Valuation Report is an in-depth analysis detailing your home's value as well as a comparison with similar homes in the area
Purchase History
| Date | Buyer | Sale Price | Title Company |
|---|---|---|---|
| Morgan Michael G | -- | Magellan Title | |
| Funaki Feofaaki K | -- | Tooele Title Company |
Source: Public Records
Mortgage History
| Date | Status | Borrower | Loan Amount |
|---|---|---|---|
| Open | Morgan Michael G | $163,496 | |
| Previous Owner | Funaki Feofaaki K | $136,000 |
Source: Public Records
Tax History
| Year | Tax Paid | Tax Assessment Tax Assessment Total Assessment is a certain percentage of the fair market value that is determined by local assessors to be the total taxable value of land and additions on the property. | Land | Improvement |
|---|---|---|---|---|
| 2025 | $2,575 | $390,516 | $89,000 | $301,516 |
| 2024 | $2,933 | $223,871 | $48,950 | $174,921 |
| 2023 | $2,933 | $231,544 | $47,542 | $184,002 |
| 2022 | $2,087 | $179,586 | $56,100 | $123,486 |
| 2021 | $1,892 | $136,189 | $37,400 | $98,789 |
| 2020 | $1,759 | $219,616 | $40,000 | $179,616 |
| 2019 | $1,656 | $203,287 | $40,000 | $163,287 |
| 2018 | $1,532 | $178,379 | $40,000 | $138,379 |
| 2017 | $1,428 | $197,276 | $28,125 | $169,151 |
| 2016 | $1,167 | $96,367 | $15,469 | $80,898 |
| 2015 | $1,167 | $84,863 | $0 | $0 |
| 2014 | -- | $84,863 | $0 | $0 |
Source: Public Records
Map
Nearby Homes
Your Personal Tour Guide
Ask me questions while you tour the home.