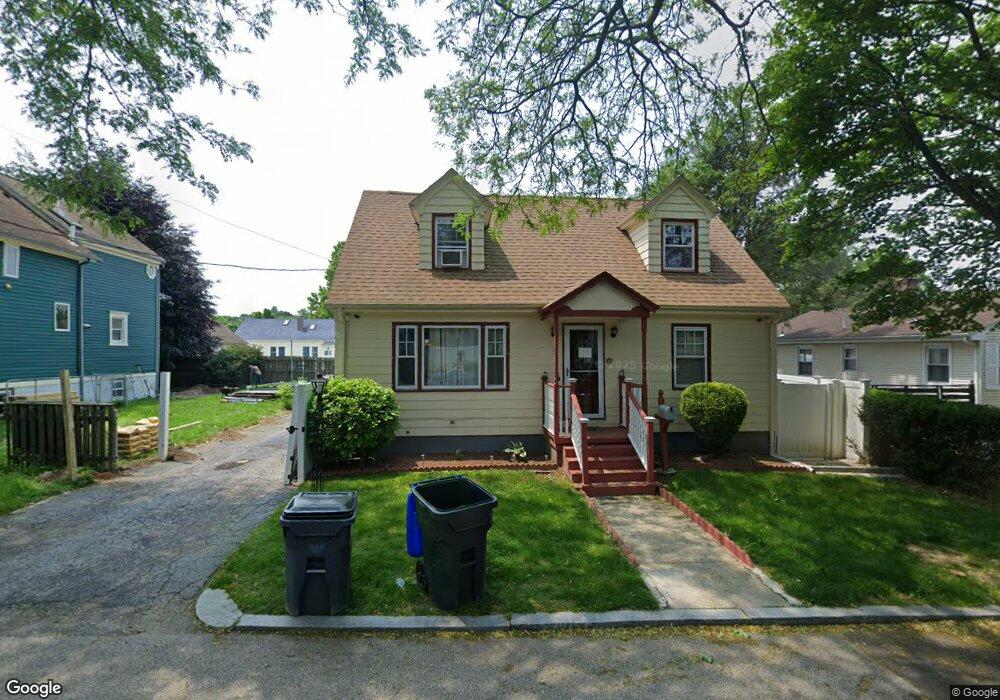
36 Samoset Ave Providence, RI 02908
Manton NeighborhoodEstimated Value: $422,041 - $550,000
3
Beds
2
Baths
1,500
Sq Ft
$327/Sq Ft
Est. Value
About This Home
This home is located at 36 Samoset Ave, Providence, RI 02908 and is currently estimated at $490,260, approximately $326 per square foot. 36 Samoset Ave is a home located in Providence County with nearby schools including Charles N. Fortes Elementary School, Asa Messer Elementary School, and Laurel Hill Annex School.
Ownership History
Date
Name
Owned For
Owner Type
Purchase Details
Closed on
Dec 8, 2014
Sold by
Quezada Jose H
Bought by
Brito Tony and Navarro Natividad J
Current Estimated Value
Home Financials for this Owner
Home Financials are based on the most recent Mortgage that was taken out on this home.
Original Mortgage
$149,246
Outstanding Balance
$115,486
Interest Rate
3.93%
Mortgage Type
FHA
Estimated Equity
$374,774
Purchase Details
Closed on
Jul 3, 2000
Sold by
Nardolillo Deena M
Bought by
Quezada Jose H
Home Financials for this Owner
Home Financials are based on the most recent Mortgage that was taken out on this home.
Original Mortgage
$94,223
Interest Rate
8.59%
Mortgage Type
Purchase Money Mortgage
Purchase Details
Closed on
Nov 4, 1994
Sold by
Nardolillo David and Nardolillo Sandra
Bought by
Nardolillo Deena M
Create a Home Valuation Report for This Property
The Home Valuation Report is an in-depth analysis detailing your home's value as well as a comparison with similar homes in the area
Home Values in the Area
Average Home Value in this Area
Purchase History
| Date | Buyer | Sale Price | Title Company |
|---|---|---|---|
| Brito Tony | $152,000 | -- | |
| Quezada Jose H | $95,000 | -- | |
| Nardolillo Deena M | $110,000 | -- |
Source: Public Records
Mortgage History
| Date | Status | Borrower | Loan Amount |
|---|---|---|---|
| Open | Brito Tony | $149,246 | |
| Previous Owner | Nardolillo Deena M | $170,000 | |
| Previous Owner | Nardolillo Deena M | $124,000 | |
| Previous Owner | Nardolillo Deena M | $97,000 | |
| Previous Owner | Nardolillo Deena M | $94,223 |
Source: Public Records
Tax History Compared to Growth
Tax History
| Year | Tax Paid | Tax Assessment Tax Assessment Total Assessment is a certain percentage of the fair market value that is determined by local assessors to be the total taxable value of land and additions on the property. | Land | Improvement |
|---|---|---|---|---|
| 2025 | $3,228 | $427,500 | $152,000 | $275,500 |
| 2024 | $5,369 | $292,600 | $88,000 | $204,600 |
| 2023 | $5,369 | $292,600 | $88,000 | $204,600 |
| 2022 | $5,208 | $292,600 | $88,000 | $204,600 |
| 2021 | $4,251 | $173,100 | $51,800 | $121,300 |
| 2020 | $4,251 | $173,100 | $51,800 | $121,300 |
| 2019 | $4,251 | $173,100 | $51,800 | $121,300 |
| 2018 | $3,797 | $118,800 | $47,100 | $71,700 |
| 2017 | $3,797 | $118,800 | $47,100 | $71,700 |
| 2016 | $3,797 | $118,800 | $47,100 | $71,700 |
| 2015 | $3,528 | $106,600 | $47,100 | $59,500 |
| 2014 | $3,598 | $106,600 | $47,100 | $59,500 |
| 2013 | $3,598 | $106,600 | $47,100 | $59,500 |
Source: Public Records
Map
Nearby Homes
- 88 Manomet St
- 44 Winthrop Ave
- 30 Victoria St Unit 32
- 1314 Chalkstone Ave
- 90 Winthrop Ave
- 1397 Chalkstone Ave
- 85 Winthrop Ave
- 16 Marconi St
- 94 Waller St
- 10 Carleton St
- 71 Rowan St
- 90 Farm St
- 66 Lawn St
- 66 Fairview St
- 88 Beaufort St
- 1158 Chalkstone Ave
- 107 Sisson St
- 100 Hillcrest Ave
- 149 Pomona Ave
- 21 Chaucer St