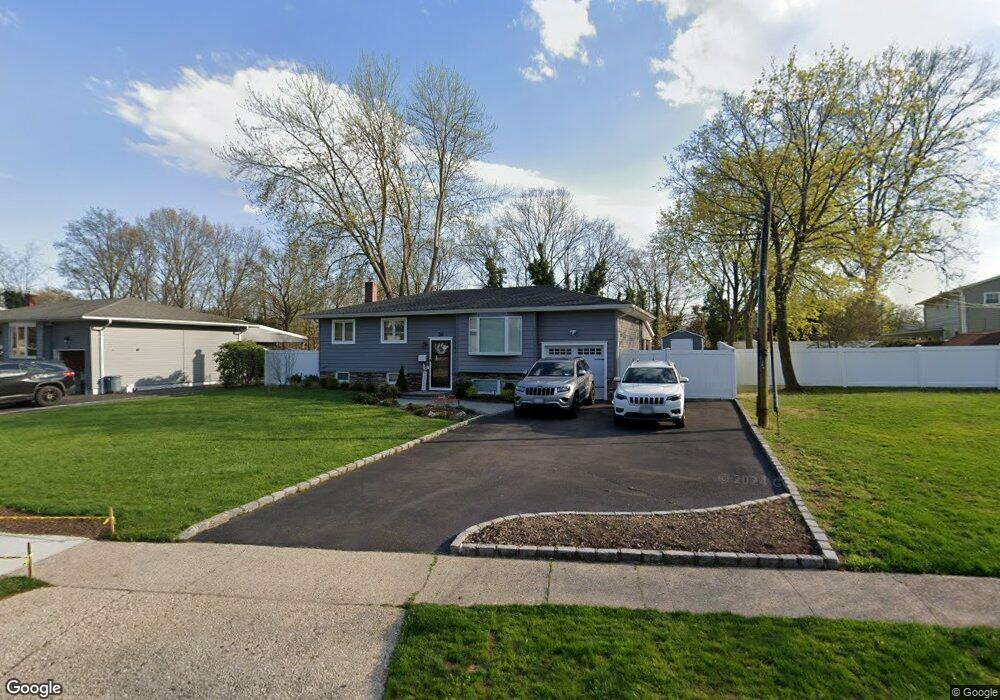
36 Seneca Dr ComMacK, NY 11725
Estimated Value: $708,141 - $734,000
3
Beds
2
Baths
1,167
Sq Ft
$613/Sq Ft
Est. Value
About This Home
This home is located at 36 Seneca Dr, ComMacK, NY 11725 and is currently estimated at $715,535, approximately $613 per square foot. 36 Seneca Dr is a home located in Suffolk County with nearby schools including Commack Middle School and Commack High School.
Ownership History
Date
Name
Owned For
Owner Type
Purchase Details
Closed on
Mar 15, 2021
Sold by
Baglivi James
Bought by
Brunoni Anthony and Brunoni Lauren
Current Estimated Value
Home Financials for this Owner
Home Financials are based on the most recent Mortgage that was taken out on this home.
Original Mortgage
$408,000
Interest Rate
2.73%
Mortgage Type
New Conventional
Purchase Details
Closed on
Feb 25, 2019
Sold by
Usa Hud
Bought by
Baglivi James
Purchase Details
Closed on
Mar 9, 2017
Sold by
Referee Of Suffolk County and Belford Esq Michael Kenedy
Bought by
Wells Fargo Bank N A
Purchase Details
Closed on
Mar 30, 2012
Sold by
Becerra Moises
Bought by
Pappas Elizabeth
Create a Home Valuation Report for This Property
The Home Valuation Report is an in-depth analysis detailing your home's value as well as a comparison with similar homes in the area
Home Values in the Area
Average Home Value in this Area
Purchase History
| Date | Buyer | Sale Price | Title Company |
|---|---|---|---|
| Brunoni Anthony | -- | None Available | |
| Brunoni Anthony | -- | None Available | |
| Baglivi James | $375,250 | -- | |
| Baglivi James | $375,250 | -- | |
| Wells Fargo Bank N A | $502,336 | None Available | |
| Wells Fargo Bank N A | $502,336 | None Available | |
| Pappas Elizabeth | $375,000 | Mkm Abstract | |
| Pappas Elizabeth | $375,000 | Mkm Abstract |
Source: Public Records
Mortgage History
| Date | Status | Borrower | Loan Amount |
|---|---|---|---|
| Previous Owner | Brunoni Anthony | $408,000 | |
| Closed | Wells Fargo Bank N A | $0 |
Source: Public Records
Tax History
| Year | Tax Paid | Tax Assessment Tax Assessment Total Assessment is a certain percentage of the fair market value that is determined by local assessors to be the total taxable value of land and additions on the property. | Land | Improvement |
|---|---|---|---|---|
| 2024 | $12,936 | $4,670 | $300 | $4,370 |
| 2023 | $12,936 | $4,670 | $300 | $4,370 |
| 2022 | $10,020 | $4,670 | $300 | $4,370 |
| 2021 | $10,020 | $4,670 | $300 | $4,370 |
| 2020 | $12,461 | $4,670 | $300 | $4,370 |
| 2019 | $12,461 | $0 | $0 | $0 |
| 2018 | -- | $4,670 | $300 | $4,370 |
| 2017 | $11,073 | $4,670 | $300 | $4,370 |
| 2016 | $10,955 | $4,670 | $300 | $4,370 |
| 2015 | -- | $4,670 | $300 | $4,370 |
| 2014 | -- | $4,670 | $300 | $4,370 |
Source: Public Records
Map
Nearby Homes
Your Personal Tour Guide
Ask me questions while you tour the home.