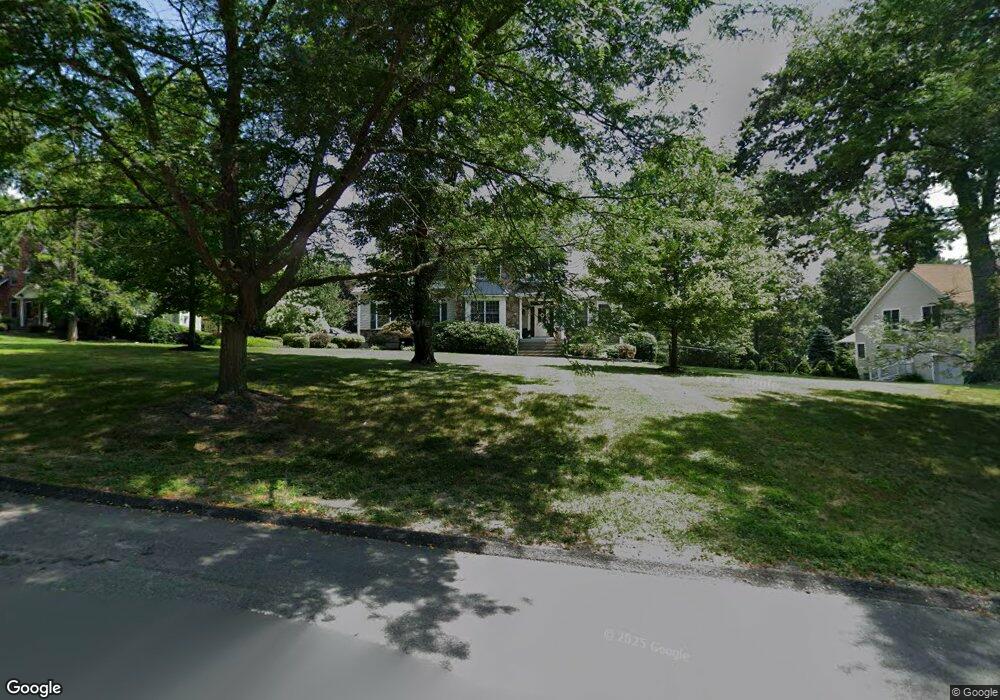
36 St Andrews Ln East Fishkill, NY 12533
Estimated Value: $930,000 - $954,000
4
Beds
3
Baths
4,889
Sq Ft
$192/Sq Ft
Est. Value
About This Home
This home is located at 36 St Andrews Ln, East Fishkill, NY 12533 and is currently estimated at $940,470, approximately $192 per square foot. 36 St Andrews Ln is a home located in Dutchess County with nearby schools including Fishkill Plains Elementary School, Van Wyck Junior High School, and John Jay Senior High School.
Ownership History
Date
Name
Owned For
Owner Type
Purchase Details
Closed on
Sep 28, 2022
Sold by
Johnson David A and Johnson Paula B
Bought by
Weinstein Michael A and Weinstein Jill
Current Estimated Value
Home Financials for this Owner
Home Financials are based on the most recent Mortgage that was taken out on this home.
Original Mortgage
$553,000
Outstanding Balance
$530,276
Interest Rate
5.55%
Mortgage Type
Purchase Money Mortgage
Estimated Equity
$410,194
Purchase Details
Closed on
Jul 14, 2011
Sold by
Predatsch Bruce
Bought by
Johnson David
Home Financials for this Owner
Home Financials are based on the most recent Mortgage that was taken out on this home.
Original Mortgage
$375,000
Interest Rate
4.51%
Mortgage Type
Purchase Money Mortgage
Purchase Details
Closed on
Nov 1, 2000
Sold by
Beekman Milestone Llc
Bought by
Predatsch Bruce
Create a Home Valuation Report for This Property
The Home Valuation Report is an in-depth analysis detailing your home's value as well as a comparison with similar homes in the area
Home Values in the Area
Average Home Value in this Area
Purchase History
| Date | Buyer | Sale Price | Title Company |
|---|---|---|---|
| Weinstein Michael A | $790,000 | None Available | |
| Johnson David | $552,000 | -- | |
| Predatsch Bruce | $459,000 | Susan Miller |
Source: Public Records
Mortgage History
| Date | Status | Borrower | Loan Amount |
|---|---|---|---|
| Open | Weinstein Michael A | $553,000 | |
| Previous Owner | Johnson David | $375,000 |
Source: Public Records
Tax History Compared to Growth
Tax History
| Year | Tax Paid | Tax Assessment Tax Assessment Total Assessment is a certain percentage of the fair market value that is determined by local assessors to be the total taxable value of land and additions on the property. | Land | Improvement |
|---|---|---|---|---|
| 2024 | $16,715 | $808,800 | $174,500 | $634,300 |
| 2023 | $20,746 | $762,700 | $174,500 | $588,200 |
| 2022 | $20,229 | $693,400 | $174,500 | $518,900 |
| 2021 | $18,579 | $619,100 | $174,500 | $444,600 |
| 2020 | $14,361 | $573,200 | $174,500 | $398,700 |
| 2019 | $13,881 | $573,200 | $174,500 | $398,700 |
| 2018 | $12,805 | $540,800 | $174,500 | $366,300 |
| 2017 | $12,641 | $535,400 | $174,500 | $360,900 |
| 2016 | $12,610 | $535,400 | $174,500 | $360,900 |
| 2015 | -- | $535,400 | $174,500 | $360,900 |
| 2014 | -- | $535,400 | $174,500 | $360,900 |
Source: Public Records
Map
Nearby Homes
- 59 Spy Glass Hill
- 20 Pinebrook Loop
- 15 Champlain Dr
- 16 Ballymeade Rd
- 8 Bykenhulle Rd
- 11 Taconic Dr
- 1282 Route 82
- 42 Bayberry St
- 4 Hamlet Way
- 16 Woodcrest Dr
- 105 Oak Ridge Rd
- 1281 Route 82
- 123 Creamery Rd
- 16 Avalon Ct
- 35 Glanhope Rd Unit 20
- 50 Hemlock Dr
- 1345 Route 82
- 50 Glanhope Rd Unit 23
- 22 Lenart Place
- 14 Chestnut St
- 30 St Andrews Ln
- 30 Saint Andrews Ln
- 40 Saint Andrews Ln
- 24 Saint Andrews Ln
- 37 Saint Andrews Ln
- 46 Saint Andrews Ln
- 6 Riviera Dr
- 47 St Andrews Ln
- 47 Saint Andrews Ln
- 14 Saint Andrews Ln
- 10 Riviera Dr
- 50 Saint Andrews Ln
- 50 St Andrews Ln
- 55 St Andrews Ln
- 5 Riviera Dr
- 55 Saint Andrews Ln
- 39 Saint Andrews Ln
- 12 Riviera Dr
- 11 Riviera Dr
- 39 St Andrews Ln