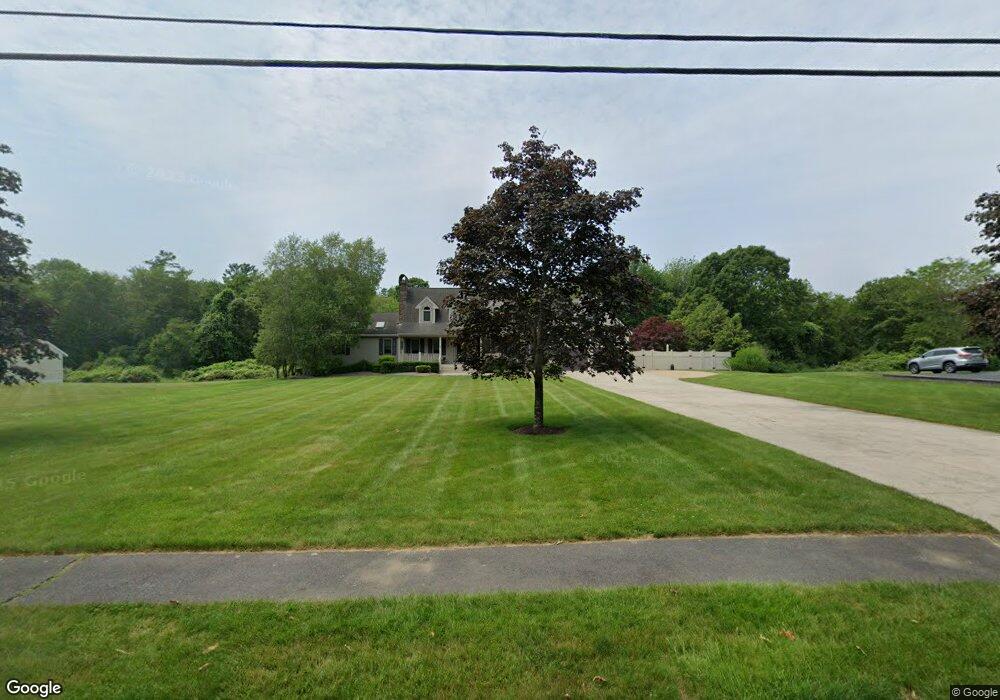
36 Stoney Rd West Bridgewater, MA 02379
Estimated Value: $808,099 - $838,000
3
Beds
3
Baths
2,568
Sq Ft
$323/Sq Ft
Est. Value
About This Home
This home is located at 36 Stoney Rd, West Bridgewater, MA 02379 and is currently estimated at $828,525, approximately $322 per square foot. 36 Stoney Rd is a home located in Plymouth County with nearby schools including Spring Street Elementary School, Rose L. MacDonald Elementary School, and Howard Elementary School.
Ownership History
Date
Name
Owned For
Owner Type
Purchase Details
Closed on
Sep 26, 2007
Sold by
May Robert R and May Doris G
Bought by
May Sr Tr Robert R and May Doris G
Current Estimated Value
Create a Home Valuation Report for This Property
The Home Valuation Report is an in-depth analysis detailing your home's value as well as a comparison with similar homes in the area
Home Values in the Area
Average Home Value in this Area
Purchase History
| Date | Buyer | Sale Price | Title Company |
|---|---|---|---|
| May Sr Tr Robert R | -- | -- |
Source: Public Records
Mortgage History
| Date | Status | Borrower | Loan Amount |
|---|---|---|---|
| Open | May Sr Tr Robert R | $360,000 | |
| Previous Owner | May Sr Tr Robert R | $163,000 |
Source: Public Records
Tax History Compared to Growth
Tax History
| Year | Tax Paid | Tax Assessment Tax Assessment Total Assessment is a certain percentage of the fair market value that is determined by local assessors to be the total taxable value of land and additions on the property. | Land | Improvement |
|---|---|---|---|---|
| 2025 | $10,129 | $741,000 | $277,400 | $463,600 |
| 2024 | $9,716 | $685,700 | $273,000 | $412,700 |
| 2023 | $9,568 | $622,500 | $254,400 | $368,100 |
| 2022 | $8,626 | $531,800 | $213,000 | $318,800 |
| 2021 | $0 | $490,800 | $193,400 | $297,400 |
| 2020 | $8,034 | $490,800 | $193,400 | $297,400 |
| 2019 | $7,794 | $471,500 | $193,400 | $278,100 |
| 2018 | $7,762 | $453,900 | $180,300 | $273,600 |
| 2017 | $7,718 | $435,300 | $169,500 | $265,800 |
| 2016 | $7,639 | $424,400 | $158,600 | $265,800 |
| 2015 | $7,181 | $403,200 | $158,600 | $244,600 |
| 2014 | $6,560 | $397,800 | $158,600 | $239,200 |
Source: Public Records
Map
Nearby Homes