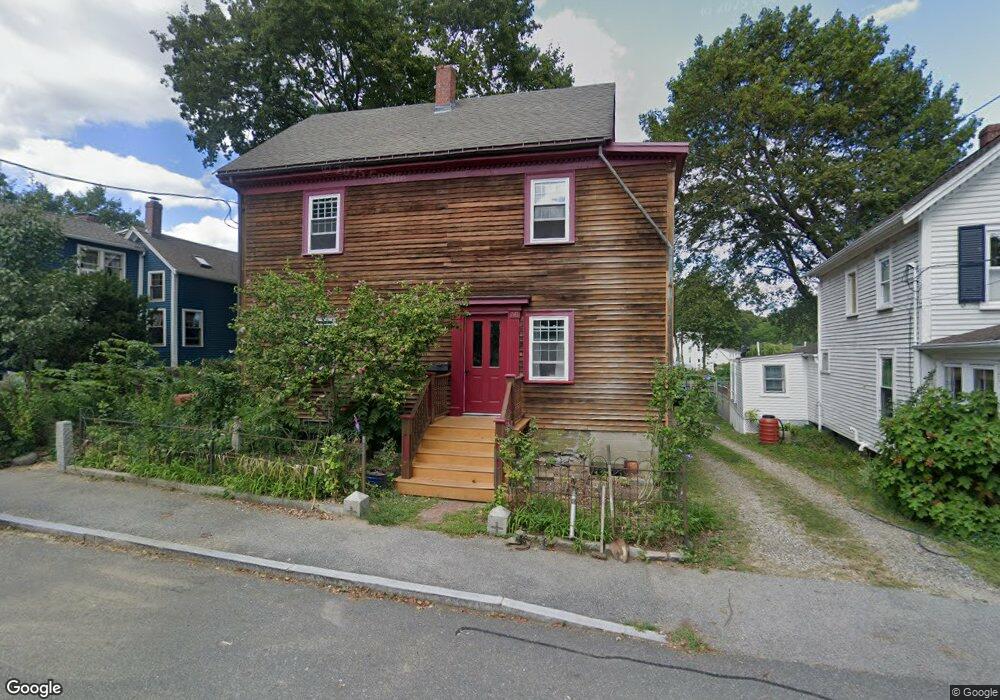
36 Summer St Ipswich, MA 01938
Estimated Value: $465,949 - $781,000
6
Beds
3
Baths
2,500
Sq Ft
$227/Sq Ft
Est. Value
About This Home
This home is located at 36 Summer St, Ipswich, MA 01938 and is currently estimated at $566,487, approximately $226 per square foot. 36 Summer St is a home located in Essex County with nearby schools including Ipswich High School, North Shore Montessori School, and Pingree School.
Ownership History
Date
Name
Owned For
Owner Type
Purchase Details
Closed on
Jul 31, 2025
Sold by
Gabriel John V
Bought by
Carl E Walter First Ret and Walter
Current Estimated Value
Purchase Details
Closed on
Mar 20, 2025
Sold by
Gabriel John V
Bought by
Blomberg Carl and Blomberg Helaine
Purchase Details
Closed on
Mar 7, 2017
Sold by
Gabriel Ft and Gabriel
Bought by
Gabriel Gerald V and Gabriel Mary M
Purchase Details
Closed on
Feb 10, 2011
Sold by
Lemire Matthew
Bought by
Gabriel Ft and Gabriel
Purchase Details
Closed on
Jan 19, 2007
Sold by
Pomakis Patricia T
Bought by
Lemire Matthew E
Create a Home Valuation Report for This Property
The Home Valuation Report is an in-depth analysis detailing your home's value as well as a comparison with similar homes in the area
Home Values in the Area
Average Home Value in this Area
Purchase History
| Date | Buyer | Sale Price | Title Company |
|---|---|---|---|
| Carl E Walter First Ret | $495,000 | -- | |
| Carl E Walter First Ret | $495,000 | -- | |
| Carl E Walter First Ret | $495,000 | -- | |
| Blomberg Carl | $475,000 | None Available | |
| Blomberg Carl | $475,000 | None Available | |
| Blomberg Carl | $475,000 | None Available | |
| Gabriel Gerald V | -- | -- | |
| Gabriel John V | -- | -- | |
| Gabriel John V | -- | -- | |
| Gabriel Gerald V | -- | -- | |
| Gabriel Gerald V | -- | -- | |
| Gabriel Ft | $325,000 | -- | |
| Gabriel Ft | $325,000 | -- | |
| Gabriel Ft | $325,000 | -- | |
| Gabriel Ft | $325,000 | -- | |
| Gabriel Ft | $325,000 | -- | |
| Lemire Matthew E | $380,000 | -- | |
| Lemire Matthew E | $380,000 | -- |
Source: Public Records
Mortgage History
| Date | Status | Borrower | Loan Amount |
|---|---|---|---|
| Previous Owner | Lemire Matthew E | $409,000 | |
| Previous Owner | Lemire Matthew E | $404,985 |
Source: Public Records
Tax History
| Year | Tax Paid | Tax Assessment Tax Assessment Total Assessment is a certain percentage of the fair market value that is determined by local assessors to be the total taxable value of land and additions on the property. | Land | Improvement |
|---|---|---|---|---|
| 2025 | $6,873 | $616,400 | $307,500 | $308,900 |
| 2024 | $6,311 | $554,600 | $306,200 | $248,400 |
| 2023 | $6,054 | $495,000 | $257,900 | $237,100 |
| 2022 | $5,971 | $464,300 | $251,400 | $212,900 |
| 2021 | $5,968 | $451,400 | $249,800 | $201,600 |
| 2020 | $6,222 | $443,800 | $251,400 | $192,400 |
| 2019 | $5,867 | $416,400 | $243,400 | $173,000 |
| 2018 | $5,769 | $405,100 | $233,700 | $171,400 |
| 2017 | $5,748 | $405,100 | $225,600 | $179,500 |
| 2016 | $5,321 | $358,300 | $212,700 | $145,600 |
| 2015 | $4,645 | $343,800 | $207,900 | $135,900 |
Source: Public Records
Map
Nearby Homes
- 29 Summer St Unit 15
- 57 East St
- 45 County St Unit 4
- 16 Elm St
- 70 East St
- 7 Woods Ln
- 59 S Main St Unit 1
- 64 County Rd Unit 1
- 50 Market St Unit 2
- 11 Washington St Unit 11
- 11 Washington St Unit 7
- 11 Washington St Unit 5
- 11 Washington St Unit 4
- 11 Washington St Unit 12
- 2 Heartbreak Hill
- 21 Brownville Ave
- 20 Caroline Ave
- 8 Cleveland Ave
- 9 Ryan Ave
- 500 Colonial Dr Unit 5
Your Personal Tour Guide
Ask me questions while you tour the home.