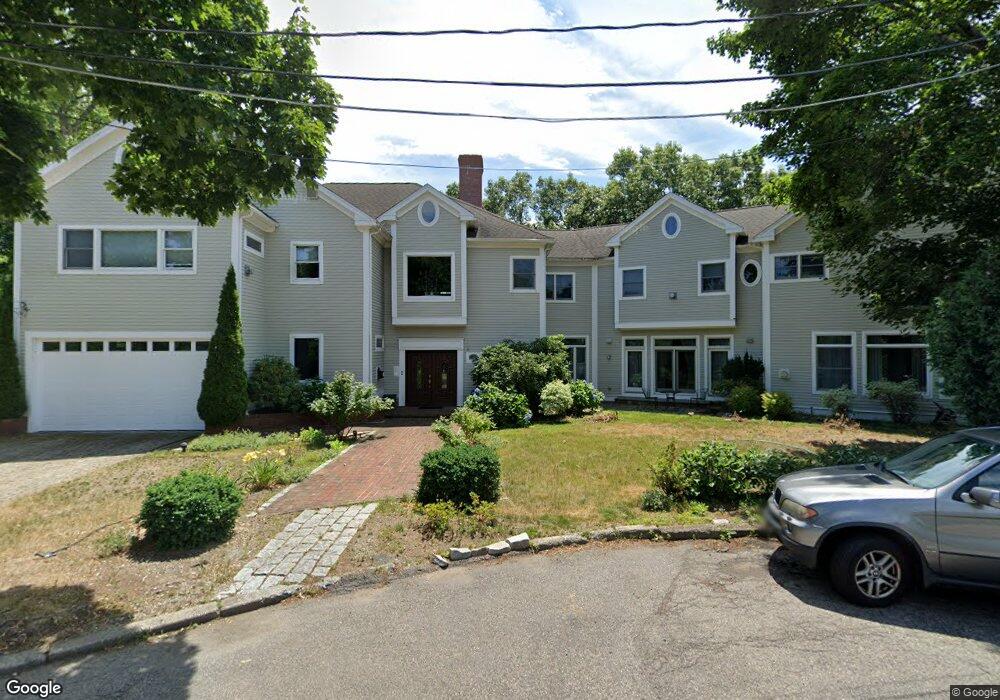
36 Sunhill Ln Unit Side Newton Center, MA 02459
Thompsonville NeighborhoodEstimated Value: $1,303,000 - $3,996,000
5
Beds
1
Bath
300
Sq Ft
$9,886/Sq Ft
Est. Value
About This Home
This home is located at 36 Sunhill Ln Unit Side, Newton Center, MA 02459 and is currently estimated at $2,965,734, approximately $9,885 per square foot. 36 Sunhill Ln Unit Side is a home located in Middlesex County with nearby schools including Bowen School, Oak Hill Middle School, and Newton South High School.
Ownership History
Date
Name
Owned For
Owner Type
Purchase Details
Closed on
Dec 10, 2013
Sold by
Chu Doris
Bought by
International Society
Current Estimated Value
Purchase Details
Closed on
Jun 19, 2012
Sold by
Ziya-Mobed Seyed
Bought by
Chu Doris
Purchase Details
Closed on
Sep 24, 2003
Sold by
36 Sunhill Lane Rt
Bought by
Mobed Seyed Z and Mobed Seyed Ziya
Home Financials for this Owner
Home Financials are based on the most recent Mortgage that was taken out on this home.
Original Mortgage
$1,395,000
Interest Rate
6.29%
Purchase Details
Closed on
Mar 30, 1990
Sold by
Fryklund Gabriele L
Bought by
Mobed Mehrdad
Create a Home Valuation Report for This Property
The Home Valuation Report is an in-depth analysis detailing your home's value as well as a comparison with similar homes in the area
Home Values in the Area
Average Home Value in this Area
Purchase History
| Date | Buyer | Sale Price | Title Company |
|---|---|---|---|
| International Society | -- | -- | |
| Chu Doris | $1,750,000 | -- | |
| Mobed Seyed Z | -- | -- | |
| Mobed Mehrdad | $224,000 | -- |
Source: Public Records
Mortgage History
| Date | Status | Borrower | Loan Amount |
|---|---|---|---|
| Previous Owner | Mobed Seyed Z | $1,395,000 | |
| Previous Owner | Mobed Mehrdad | $400,000 | |
| Previous Owner | Mobed Mehrdad | $400,000 | |
| Previous Owner | Mobed Mehrdad | $42,000 | |
| Previous Owner | Mobed Mehrdad | $256,000 |
Source: Public Records
Tax History Compared to Growth
Tax History
| Year | Tax Paid | Tax Assessment Tax Assessment Total Assessment is a certain percentage of the fair market value that is determined by local assessors to be the total taxable value of land and additions on the property. | Land | Improvement |
|---|---|---|---|---|
| 2025 | $34,059 | $3,475,400 | $968,700 | $2,506,700 |
| 2024 | $32,932 | $3,374,200 | $940,500 | $2,433,700 |
| 2023 | $28,305 | $2,780,500 | $638,100 | $2,142,400 |
| 2022 | $27,084 | $2,574,500 | $590,800 | $1,983,700 |
| 2021 | $26,134 | $2,428,800 | $557,400 | $1,871,400 |
| 2020 | $25,357 | $2,428,800 | $557,400 | $1,871,400 |
| 2019 | $24,642 | $2,358,100 | $541,200 | $1,816,900 |
| 2018 | $24,699 | $2,282,700 | $486,000 | $1,796,700 |
| 2017 | $23,947 | $2,153,500 | $458,500 | $1,695,000 |
| 2016 | $22,903 | $2,012,600 | $428,500 | $1,584,100 |
| 2015 | $21,837 | $1,880,900 | $400,500 | $1,480,400 |
Source: Public Records
Map
Nearby Homes
- 625 Boylston St
- 42 Sunhill Ln
- 628 Boylston St
- 671 Boylston St
- 21 Philbrick Rd
- 5 Halcyon Rd
- 19 Selwyn Rd
- 125 Oakdale Rd
- 35 Haynes Rd
- 42 Bow Rd
- 1308 Walnut St
- 1292 Walnut St
- 1597 Centre St Unit 1597
- 1597 Centre St
- 85 Dudley Rd
- 45 Brandeis Rd
- 1623-1625 Centre St
- 250 Woodcliff Rd
- 1629 Centre St
- 9 Ripley St Unit 1
- 36 Sunhill Ln
- 36 Sunhill Ln Unit 36
- 36 Sunhill Ln
- 36 Sunhill Ln Unit 2A
- 36 Sunhill Ln Unit 2B
- 36 Sunhill Ln Unit B
- 36 Sunhill Ln Unit G
- 36 Sunhill Ln Unit A
- 36 Sunhill Ln Unit G1
- 36 Sunhill Ln Unit 2
- 0 Sunhill Ln
- 30 Sunhill Ln
- 625 Boylston St Unit A
- 158 Clark St
- 619 Boylston St
- 152 Clark St
- 619 Boylston St
- 219 Parker St
- 144 Clark St
- 159 Clark St Unit 161