Estimated Value: $390,000 - $463,000
2
Beds
1
Bath
1,416
Sq Ft
$298/Sq Ft
Est. Value
About This Home
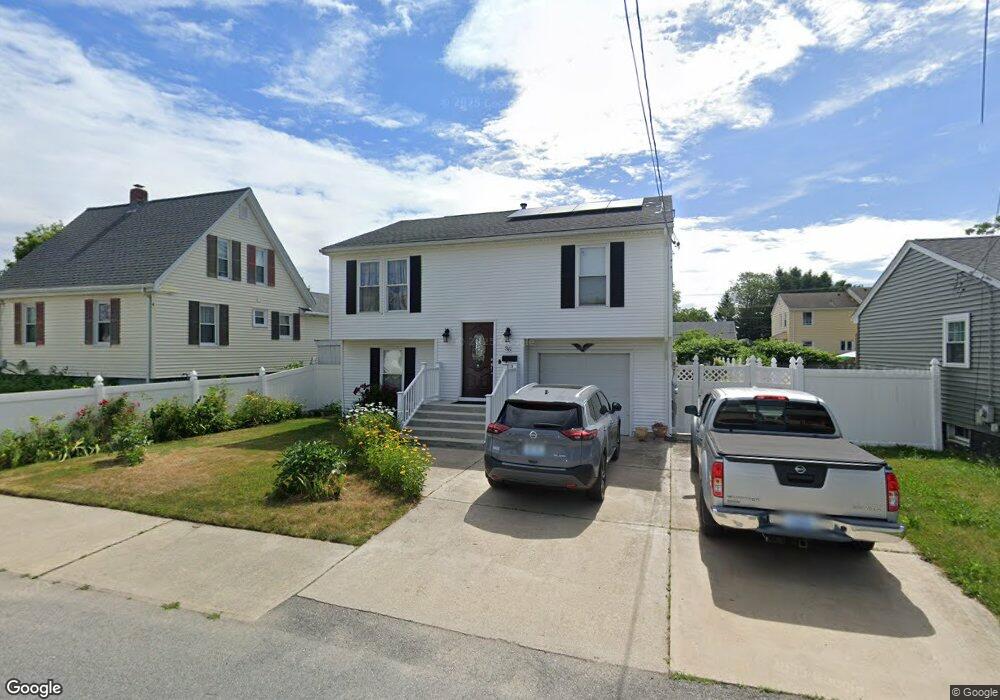
This home is located at 36 Swan St, East Providence, RI 02914 and is currently estimated at $421,496, approximately $297 per square foot. 36 Swan St is a home located in Providence County with nearby schools including East Providence High School, Ocean State Montessori School, and The Gordon School.
Ownership History
Date
Name
Owned For
Owner Type
Purchase Details
Closed on
Jun 7, 2011
Sold by
Vital John M and Vital Lucilia
Bought by
Vital John M
Current Estimated Value
Purchase Details
Closed on
Aug 20, 1998
Sold by
Winquist Carl A
Bought by
Dorego-Vital Jose and Vital Silvana
Create a Home Valuation Report for This Property
The Home Valuation Report is an in-depth analysis detailing your home's value as well as a comparison with similar homes in the area
Home Values in the Area
Average Home Value in this Area
Purchase History
| Date | Buyer | Sale Price | Title Company |
|---|---|---|---|
| Vital John M | -- | -- | |
| Dorego-Vital Jose | $107,000 | -- | |
| Vital John M | -- | -- | |
| Dorego-Vital Jose | $107,000 | -- |
Source: Public Records
Mortgage History
| Date | Status | Borrower | Loan Amount |
|---|---|---|---|
| Open | Dorego-Vital Jose | $12,837 |
Source: Public Records
Tax History Compared to Growth
Tax History
| Year | Tax Paid | Tax Assessment Tax Assessment Total Assessment is a certain percentage of the fair market value that is determined by local assessors to be the total taxable value of land and additions on the property. | Land | Improvement |
|---|---|---|---|---|
| 2025 | $4,878 | $373,200 | $89,000 | $284,200 |
| 2024 | $4,749 | $309,800 | $74,100 | $235,700 |
| 2023 | $4,573 | $309,800 | $74,100 | $235,700 |
| 2022 | $4,274 | $195,500 | $39,600 | $155,900 |
| 2021 | $4,203 | $195,500 | $39,600 | $155,900 |
| 2020 | $4,025 | $195,500 | $39,600 | $155,900 |
| 2019 | $3,914 | $195,500 | $39,600 | $155,900 |
| 2018 | $4,027 | $176,000 | $41,300 | $134,700 |
| 2017 | $3,937 | $176,000 | $41,300 | $134,700 |
| 2016 | $3,918 | $176,000 | $41,300 | $134,700 |
| 2015 | $3,573 | $155,700 | $33,400 | $122,300 |
| 2014 | $3,573 | $155,700 | $33,400 | $122,300 |
Source: Public Records
Map
Nearby Homes
- 9 Apulia St
- 17 Brown St Unit 19
- 132 S Rose St
- 26 Mayflower St
- 18 Baker St Unit 20
- 108 Bliss St
- 109 Bliss St
- 674 N Broadway
- 41 What Cheer Ave
- 164 Brightridge Ave
- 661 N Broadway
- 25 Fairview Ave
- 200 Woodward Ave
- 78 Ingraham St
- 400 Juniper St Unit A
- 400 Juniper St Unit B
- 400 Juniper St Unit C
- 25 Ide Ave
- 15 S Carpenter St
- 152 Freeborn Ave