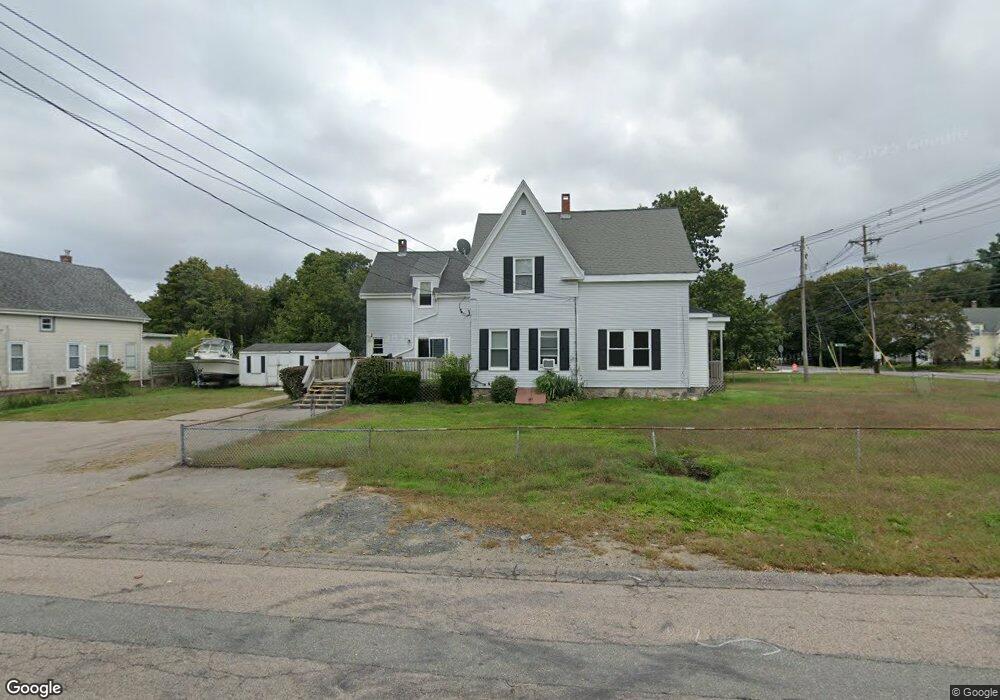
36 Temple St Abington, MA 02351
Estimated Value: $470,524 - $693,000
3
Beds
1
Bath
1,439
Sq Ft
$398/Sq Ft
Est. Value
About This Home
This home is located at 36 Temple St, Abington, MA 02351 and is currently estimated at $573,131, approximately $398 per square foot. 36 Temple St is a home located in Plymouth County with nearby schools including Beaver Brook Elementary School, Abington Middle School, and Woodsdale School.
Ownership History
Date
Name
Owned For
Owner Type
Purchase Details
Closed on
May 22, 2024
Sold by
Hill Jean L
Bought by
Alexander Ft and Hill
Current Estimated Value
Purchase Details
Closed on
Apr 25, 2007
Sold by
Hill Ronald P and Hill Jean L
Bought by
Hill Jean L
Purchase Details
Closed on
May 1, 1990
Sold by
Deroy Richard R
Bought by
Hill Ronald P
Home Financials for this Owner
Home Financials are based on the most recent Mortgage that was taken out on this home.
Original Mortgage
$117,400
Interest Rate
10.26%
Mortgage Type
Purchase Money Mortgage
Create a Home Valuation Report for This Property
The Home Valuation Report is an in-depth analysis detailing your home's value as well as a comparison with similar homes in the area
Home Values in the Area
Average Home Value in this Area
Purchase History
| Date | Buyer | Sale Price | Title Company |
|---|---|---|---|
| Alexander Ft | -- | None Available | |
| Alexander Ft | -- | None Available | |
| Hill Jean L | -- | -- | |
| Hill Jean L | -- | -- | |
| Hill Ronald P | $127,000 | -- |
Source: Public Records
Mortgage History
| Date | Status | Borrower | Loan Amount |
|---|---|---|---|
| Previous Owner | Hill Ronald P | $111,900 | |
| Previous Owner | Hill Ronald P | $117,400 |
Source: Public Records
Tax History
| Year | Tax Paid | Tax Assessment Tax Assessment Total Assessment is a certain percentage of the fair market value that is determined by local assessors to be the total taxable value of land and additions on the property. | Land | Improvement |
|---|---|---|---|---|
| 2025 | $5,466 | $418,500 | $239,800 | $178,700 |
| 2024 | $5,340 | $399,100 | $218,100 | $181,000 |
| 2023 | $5,134 | $361,300 | $189,700 | $171,600 |
| 2022 | $4,925 | $323,600 | $166,100 | $157,500 |
| 2021 | $21,312 | $278,900 | $150,700 | $128,200 |
| 2020 | $4,853 | $274,300 | $146,100 | $128,200 |
| 2019 | $4,386 | $252,200 | $139,200 | $113,000 |
| 2018 | $4,341 | $243,600 | $139,200 | $104,400 |
| 2017 | $4,160 | $226,700 | $139,200 | $87,500 |
| 2016 | $3,946 | $220,100 | $132,600 | $87,500 |
| 2015 | $3,825 | $225,000 | $132,600 | $92,400 |
Source: Public Records
Map
Nearby Homes
- 1353 Washington St
- 0 Bedford St
- 1065 Bedford St
- 1077 Bedford St
- 338 Adams St
- 35 Adams St
- 337 Randolph St
- 120 Glen St
- 73 Monroe St
- 451 Lincoln St
- 66 Coleman St
- 332 Hancock St
- 22 Kingswood Dr Unit 6F
- 14 Jamieson St
- 720 Hancock St
- 189 Sheri Ln
- 20 Birch St
- 40 Fir Rd Unit 386
- 42 Van Buren Dr
- 17 Birch St Unit 135
Your Personal Tour Guide
Ask me questions while you tour the home.