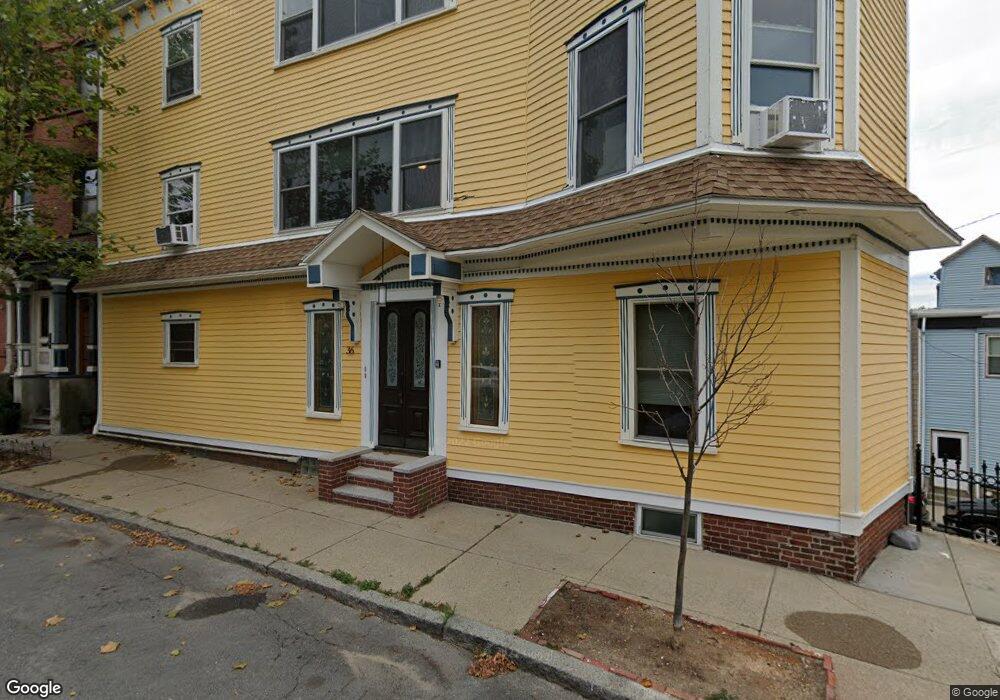
36 Thomas Park Boston, MA 02127
South Boston NeighborhoodEstimated Value: $1,947,000 - $2,345,000
7
Beds
4
Baths
3,235
Sq Ft
$681/Sq Ft
Est. Value
About This Home
This home is located at 36 Thomas Park, Boston, MA 02127 and is currently estimated at $2,203,627, approximately $681 per square foot. 36 Thomas Park is a home located in Suffolk County with nearby schools including Up Academy Charter School Of Boston, St Peter Academy, and Gate of Heaven Elementary School.
Ownership History
Date
Name
Owned For
Owner Type
Purchase Details
Closed on
Dec 28, 2022
Sold by
Jpom Llc
Bought by
Gangeswater Holdings Llc
Current Estimated Value
Home Financials for this Owner
Home Financials are based on the most recent Mortgage that was taken out on this home.
Original Mortgage
$1,335,000
Outstanding Balance
$1,290,962
Interest Rate
6.61%
Mortgage Type
Purchase Money Mortgage
Estimated Equity
$912,665
Purchase Details
Closed on
Aug 6, 2020
Sold by
36 Thomas Park Llc
Bought by
Torrington Lane Rt and Jpom Llc Tr
Home Financials for this Owner
Home Financials are based on the most recent Mortgage that was taken out on this home.
Original Mortgage
$1,275,000
Interest Rate
3.1%
Mortgage Type
Purchase Money Mortgage
Purchase Details
Closed on
Feb 27, 2018
Sold by
Ditullio Joseph
Bought by
36 Thomas Park Llc
Purchase Details
Closed on
Jul 6, 2017
Sold by
Helfman Joan
Bought by
Ditullio Joseph
Home Financials for this Owner
Home Financials are based on the most recent Mortgage that was taken out on this home.
Original Mortgage
$1,084,000
Interest Rate
4%
Mortgage Type
Purchase Money Mortgage
Purchase Details
Closed on
Jun 30, 2006
Sold by
Strigler William L
Bought by
Helfman Joan
Purchase Details
Closed on
Aug 22, 2000
Sold by
Wonsch Benjamin and Oneil Kevin P
Bought by
Strigler William L and Helfman Joan
Purchase Details
Closed on
Apr 8, 1993
Sold by
Meridian Mtg Corp
Bought by
Buckley Steven J and Oneil Kevin P
Purchase Details
Closed on
Aug 21, 1992
Sold by
Sferrazza Thomas J
Bought by
Meridian Mtg Corp
Purchase Details
Closed on
Dec 14, 1990
Sold by
Mcgannon Donald H
Bought by
Mcgannon Donald H
Create a Home Valuation Report for This Property
The Home Valuation Report is an in-depth analysis detailing your home's value as well as a comparison with similar homes in the area
Home Values in the Area
Average Home Value in this Area
Purchase History
| Date | Buyer | Sale Price | Title Company |
|---|---|---|---|
| Gangeswater Holdings Llc | $2,100,000 | None Available | |
| Torrington Lane Rt | $1,700,000 | None Available | |
| 36 Thomas Park Llc | -- | -- | |
| 36 Thomas Park Llc | -- | -- | |
| Ditullio Joseph | $1,355,000 | -- | |
| Helfman Joan | -- | -- | |
| Helfman Joan | -- | -- | |
| Strigler William L | $530,000 | -- | |
| Strigler William L | $530,000 | -- | |
| Buckley Steven J | $70,000 | -- | |
| Buckley Steven J | $70,000 | -- | |
| Meridian Mtg Corp | $170,000 | -- | |
| Meridian Mtg Corp | $170,000 | -- | |
| Mcgannon Donald H | $10,000 | -- |
Source: Public Records
Mortgage History
| Date | Status | Borrower | Loan Amount |
|---|---|---|---|
| Open | Gangeswater Holdings Llc | $1,335,000 | |
| Previous Owner | Torrington Lane Rt | $1,275,000 | |
| Previous Owner | Ditullio Joseph | $1,084,000 |
Source: Public Records
Property History
| Date | Event | Price | List to Sale | Price per Sq Ft |
|---|---|---|---|---|
| 10/08/2024 10/08/24 | Off Market | $2,600 | -- | -- |
| 10/08/2024 10/08/24 | Off Market | $2,600 | -- | -- |
| 10/08/2024 10/08/24 | Off Market | $2,800 | -- | -- |
| 09/04/2024 09/04/24 | For Rent | $2,600 | 0.0% | -- |
| 09/01/2024 09/01/24 | For Rent | $2,600 | -7.1% | -- |
| 09/01/2024 09/01/24 | For Rent | $2,800 | -- | -- |
Tax History
| Year | Tax Paid | Tax Assessment Tax Assessment Total Assessment is a certain percentage of the fair market value that is determined by local assessors to be the total taxable value of land and additions on the property. | Land | Improvement |
|---|---|---|---|---|
| 2025 | $22,427 | $1,936,700 | $377,100 | $1,559,600 |
| 2024 | $21,336 | $1,957,400 | $279,700 | $1,677,700 |
| 2023 | $18,709 | $1,742,000 | $248,900 | $1,493,100 |
| 2022 | $17,231 | $1,583,700 | $226,300 | $1,357,400 |
| 2021 | $16,898 | $1,583,700 | $226,300 | $1,357,400 |
| 2020 | $13,755 | $1,302,600 | $214,700 | $1,087,900 |
| 2019 | $13,080 | $1,241,000 | $171,300 | $1,069,700 |
| 2018 | $12,445 | $1,187,500 | $170,900 | $1,016,600 |
| 2017 | $11,972 | $1,130,500 | $170,900 | $959,600 |
| 2016 | $10,827 | $984,300 | $170,900 | $813,400 |
| 2015 | $9,235 | $762,600 | $139,800 | $622,800 |
| 2014 | $8,158 | $648,500 | $139,800 | $508,700 |
Source: Public Records
Map
Nearby Homes
- 66 Gates St Unit 2
- 53 Thomas Park Unit 2
- 27 Mercer St Unit 1
- 13 Pacific St
- 1306 Columbia Rd Unit 5C
- 13 Knowlton St
- 2 Pacific St
- 220 Dorchester St
- 480 E 4th St Unit 3
- 84 G St Unit 3
- 84 G St Unit PH
- 269 Gold St Unit One
- 269 Gold St Unit 2
- 269 Gold St Unit 3
- 256 Dorchester St Unit 407
- 256 Dorchester St Unit 502
- 256 Dorchester St Unit 305
- 256 Dorchester St Unit 303
- 256 Dorchester St Unit 401
- 256 Dorchester St Unit 504
- 36 Thomas Park
- 36 Thomas Park Unit 3
- 36 Thomas Park Unit 1
- 36 Thomas Park Unit 2
- 39 Thomas Park Unit 4
- 39 Thomas Park Unit 3
- 39 Thomas Park Unit 2
- 39 Thomas Park Unit 1
- 39 Thomas Park Unit 39 Thomas Park
- 39 Thomas Park
- 40 Thomas Park Unit 2
- 40 Thomas Park
- 40 Thomas Park
- 41 Thomas Park
- 41 Thomas Park Unit 1
- 41 Thomas Park Unit 2
- 61 Old Harbor St
- 42 Thomas Park
- 63 Old Harbor St
- 65 Old Harbor St
Your Personal Tour Guide
Ask me questions while you tour the home.