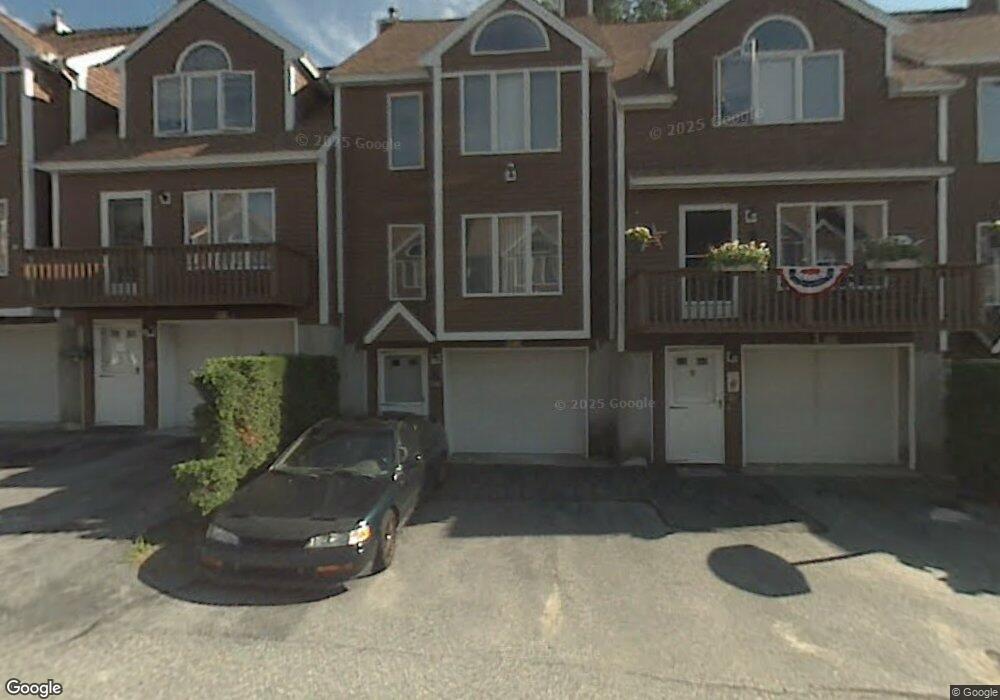
Hovey Square 36 Tobey Rd Dracut, MA 01826
Estimated Value: $382,000 - $447,000
2
Beds
2
Baths
1,261
Sq Ft
$333/Sq Ft
Est. Value
About This Home
This home is located at 36 Tobey Rd, Dracut, MA 01826 and is currently estimated at $419,979, approximately $333 per square foot. 36 Tobey Rd is a home located in Middlesex County with nearby schools including George H. Englesby Elementary School, Richardson Middle School, and Dracut Senior High School.
Ownership History
Date
Name
Owned For
Owner Type
Purchase Details
Closed on
Oct 8, 2025
Sold by
Layne Wesley M
Bought by
Wesley M Lyne Irt and Thomas
Current Estimated Value
Purchase Details
Closed on
May 13, 2005
Sold by
Hunt Matthew S
Bought by
Layne Wesley M
Purchase Details
Closed on
Aug 30, 2001
Sold by
Hall James P and Hall Kathleen A
Bought by
Hunt Matthew S
Purchase Details
Closed on
Jun 30, 1989
Sold by
Burbine Dan P
Bought by
Reilly Michael
Create a Home Valuation Report for This Property
The Home Valuation Report is an in-depth analysis detailing your home's value as well as a comparison with similar homes in the area
Home Values in the Area
Average Home Value in this Area
Purchase History
| Date | Buyer | Sale Price | Title Company |
|---|---|---|---|
| Wesley M Lyne Irt | -- | -- | |
| Layne Wesley M | $235,000 | -- | |
| Layne Wesley M | $235,000 | -- | |
| Hunt Matthew S | $169,900 | -- | |
| Reilly Michael | $125,000 | -- | |
| Reilly Michael | $125,000 | -- |
Source: Public Records
Tax History
| Year | Tax Paid | Tax Assessment Tax Assessment Total Assessment is a certain percentage of the fair market value that is determined by local assessors to be the total taxable value of land and additions on the property. | Land | Improvement |
|---|---|---|---|---|
| 2025 | $3,884 | $383,800 | $0 | $383,800 |
| 2024 | $3,739 | $357,800 | $0 | $357,800 |
| 2023 | $3,627 | $313,200 | $0 | $313,200 |
| 2022 | $3,477 | $282,900 | $0 | $282,900 |
| 2021 | $3,198 | $245,800 | $0 | $245,800 |
| 2020 | $3,189 | $238,900 | $0 | $238,900 |
| 2019 | $3,119 | $226,800 | $0 | $226,800 |
| 2018 | $2,892 | $204,500 | $0 | $204,500 |
| 2017 | $2,698 | $204,500 | $0 | $204,500 |
| 2016 | $2,409 | $162,300 | $0 | $162,300 |
| 2015 | $2,392 | $160,200 | $0 | $160,200 |
| 2014 | $2,294 | $158,300 | $0 | $158,300 |
Source: Public Records
About Hovey Square
Map
Nearby Homes
- 551 Hildreth St Unit 10
- 75 Sladen St
- 16 Peabody Ave
- 417 Hildreth St Unit 30
- 367 Hildreth St Unit 14
- 345 Hildreth St Unit 14
- 26 Farmland Rd Unit C
- 19 Louis Farm Rd Unit 19
- 13 Louis Farm Rd Unit 13
- 1391 Bridge St
- 15 Dana St
- 1563 Bridge St
- 94 Hampson St
- 1573 Bridge St
- 49 Sparks St
- 15 Louis Farm Rd Unit 15
- 54 Montaup Ave
- 40 Arlington Ave
- 69 Arlington St
- 26 Frank St
- 36 Tobey Rd Unit 40
- 36 Tobey Rd Unit 39
- 36 Tobey Rd Unit 38
- 36 Tobey Rd Unit 37
- 36 Tobey Rd Unit 34
- 36 Tobey Rd Unit 33
- 36 Tobey Rd Unit 32
- 36 Tobey Rd Unit 31
- 36 Tobey Rd Unit 30
- 36 Tobey Rd Unit 29
- 36 Tobey Rd Unit 28
- 36 Tobey Rd Unit 27
- 36 Tobey Rd Unit 26
- 36 Tobey Rd Unit 24
- 36 Tobey Rd Unit 23
- 36 Tobey Rd Unit 22
- 36 Tobey Rd Unit 21
- 36 Tobey Rd Unit 20
- 36 Tobey Rd Unit 19
- 36 Tobey Rd Unit 18
Your Personal Tour Guide
Ask me questions while you tour the home.