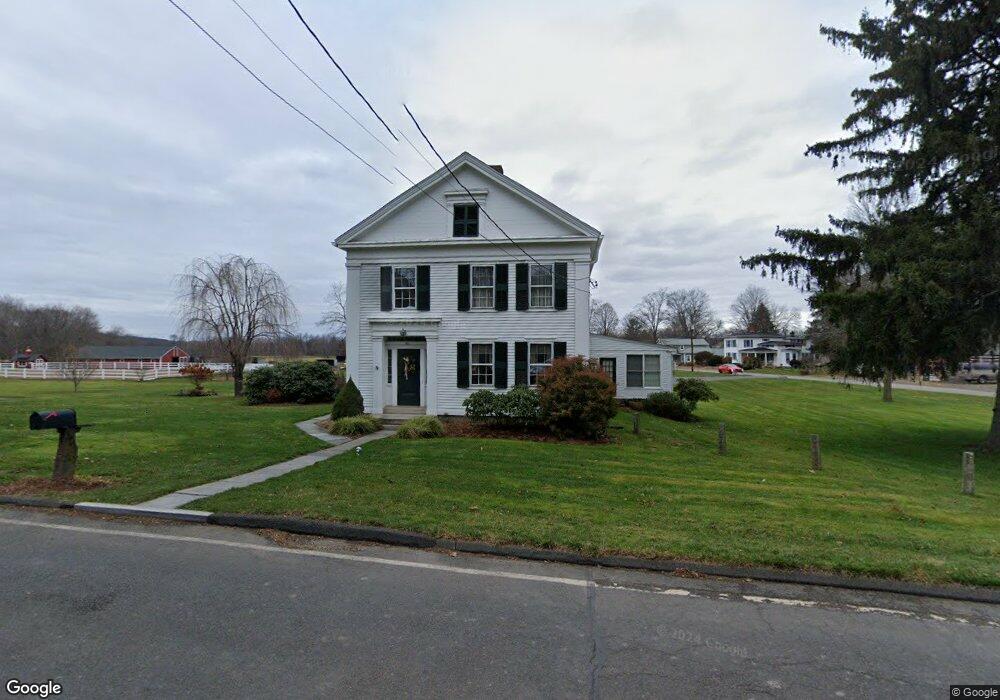
36 Tryon St South Glastonbury, CT 06073
South Glastonbury NeighborhoodEstimated Value: $627,000 - $804,000
5
Beds
3
Baths
3,248
Sq Ft
$226/Sq Ft
Est. Value
About This Home
This home is located at 36 Tryon St, South Glastonbury, CT 06073 and is currently estimated at $735,404, approximately $226 per square foot. 36 Tryon St is a home located in Hartford County with nearby schools including Nayaug Elementary School, Gideon Welles School, and Smith Middle School.
Ownership History
Date
Name
Owned For
Owner Type
Purchase Details
Closed on
Sep 29, 1995
Sold by
Narcisse Patricia and Jubrey Delia
Bought by
B A C # Seven Lp
Current Estimated Value
Purchase Details
Closed on
May 13, 1994
Sold by
Kinne Roslyn M
Bought by
Schneider Robert A and Schneider Alison T
Create a Home Valuation Report for This Property
The Home Valuation Report is an in-depth analysis detailing your home's value as well as a comparison with similar homes in the area
Home Values in the Area
Average Home Value in this Area
Purchase History
| Date | Buyer | Sale Price | Title Company |
|---|---|---|---|
| B A C # Seven Lp | $175,000 | -- | |
| Schneider Robert A | $189,900 | -- |
Source: Public Records
Mortgage History
| Date | Status | Borrower | Loan Amount |
|---|---|---|---|
| Closed | Schneider Robert A | $240,000 | |
| Closed | Schneider Robert A | $143,000 | |
| Closed | Schneider Robert A | $148,500 |
Source: Public Records
Tax History Compared to Growth
Tax History
| Year | Tax Paid | Tax Assessment Tax Assessment Total Assessment is a certain percentage of the fair market value that is determined by local assessors to be the total taxable value of land and additions on the property. | Land | Improvement |
|---|---|---|---|---|
| 2025 | $13,007 | $396,200 | $121,200 | $275,000 |
| 2024 | $12,651 | $396,200 | $121,200 | $275,000 |
| 2023 | $12,286 | $396,200 | $121,200 | $275,000 |
| 2022 | $11,626 | $311,700 | $91,900 | $219,800 |
| 2021 | $11,633 | $311,700 | $91,900 | $219,800 |
| 2020 | $11,502 | $311,700 | $91,900 | $219,800 |
| 2019 | $11,333 | $311,700 | $91,900 | $219,800 |
| 2018 | $11,171 | $310,300 | $91,900 | $218,400 |
| 2017 | $10,853 | $289,800 | $91,900 | $197,900 |
| 2016 | $10,549 | $289,800 | $91,900 | $197,900 |
| 2015 | $10,462 | $289,800 | $91,900 | $197,900 |
| 2014 | $10,331 | $289,800 | $91,900 | $197,900 |
Source: Public Records
Map
Nearby Homes
- 36 S Mill Dr Unit 36
- 30 Southgate Dr Unit 30
- 994 Main St
- 46 Red Hill Dr
- 185 Foote Rd
- 29 Northview Dr
- 120 Fallview Dr
- 124 Ridgewood Rd
- 19 Brookwood Dr Unit C
- 438 Foote Rd
- 93 Hollister Way N Unit 93G
- 507 Cedar Hollow Dr
- 32 Jennifers Way
- 71 Joiners Rd
- 1696 Main St
- 22 Shipman Dr
- 130 Main St
- 41 Talcott Rd
- 28 Colonial Dr Unit D
- 12 Colonial Dr Unit C