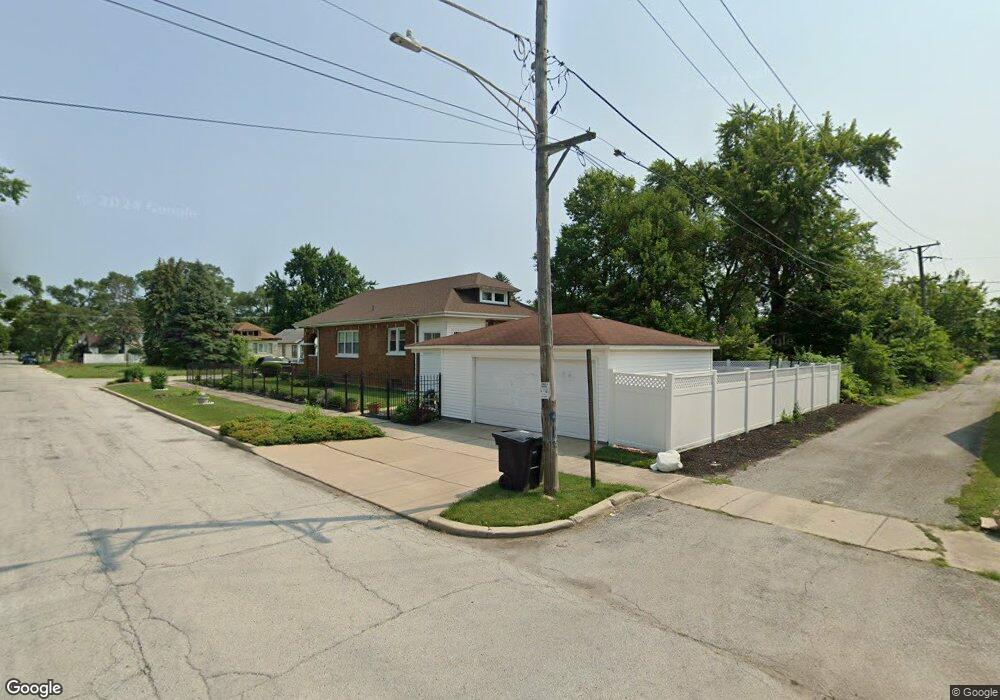
36 W 151st St Harvey, IL 60426
Estimated Value: $83,000 - $178,000
2
Beds
1
Bath
700
Sq Ft
$164/Sq Ft
Est. Value
About This Home
This home is located at 36 W 151st St, Harvey, IL 60426 and is currently estimated at $114,620, approximately $163 per square foot. 36 W 151st St is a home located in Cook County with nearby schools including Thornton Township High School.
Ownership History
Date
Name
Owned For
Owner Type
Purchase Details
Closed on
Mar 21, 2023
Sold by
Judicial Sales Corporation
Bought by
Midfirst Rank
Current Estimated Value
Purchase Details
Closed on
Oct 30, 2001
Sold by
Parr Nellie
Bought by
Parr Nellie and Parr Oscar
Home Financials for this Owner
Home Financials are based on the most recent Mortgage that was taken out on this home.
Original Mortgage
$44,660
Interest Rate
6.6%
Mortgage Type
FHA
Purchase Details
Closed on
Oct 24, 2001
Sold by
Waldroup Hulbert and Waldroup Cynthia
Bought by
Parr Nellie
Home Financials for this Owner
Home Financials are based on the most recent Mortgage that was taken out on this home.
Original Mortgage
$44,660
Interest Rate
6.6%
Mortgage Type
FHA
Purchase Details
Closed on
Aug 15, 2001
Sold by
Suburban Bank & Trust Company
Bought by
Waldroup Cynthia H and Waldroup Hulbert
Purchase Details
Closed on
Jan 6, 1998
Sold by
Chicago Title Land Trust Company
Bought by
Southwest Financial Bank and Trust #1-1521
Create a Home Valuation Report for This Property
The Home Valuation Report is an in-depth analysis detailing your home's value as well as a comparison with similar homes in the area
Home Values in the Area
Average Home Value in this Area
Purchase History
| Date | Buyer | Sale Price | Title Company |
|---|---|---|---|
| Midfirst Rank | -- | None Listed On Document | |
| Parr Nellie | -- | -- | |
| Parr Nellie | $49,000 | -- | |
| Waldroup Cynthia H | -- | -- | |
| Southwest Financial Bank | -- | -- |
Source: Public Records
Mortgage History
| Date | Status | Borrower | Loan Amount |
|---|---|---|---|
| Previous Owner | Parr Nellie | $44,660 |
Source: Public Records
Tax History Compared to Growth
Tax History
| Year | Tax Paid | Tax Assessment Tax Assessment Total Assessment is a certain percentage of the fair market value that is determined by local assessors to be the total taxable value of land and additions on the property. | Land | Improvement |
|---|---|---|---|---|
| 2024 | $1,762 | $5,800 | $1,206 | $4,594 |
| 2023 | $656 | $5,800 | $1,206 | $4,594 |
| 2022 | $656 | $4,178 | $1,206 | $2,972 |
| 2021 | $718 | $4,178 | $1,206 | $2,972 |
| 2020 | $884 | $4,178 | $1,206 | $2,972 |
| 2019 | $699 | $4,291 | $1,096 | $3,195 |
| 2018 | $672 | $4,291 | $1,096 | $3,195 |
| 2017 | $707 | $4,291 | $1,096 | $3,195 |
| 2016 | $1,671 | $4,810 | $986 | $3,824 |
| 2015 | $1,520 | $4,810 | $986 | $3,824 |
| 2014 | $1,550 | $4,810 | $986 | $3,824 |
| 2013 | $1,533 | $5,036 | $986 | $4,050 |
Source: Public Records
Map
Nearby Homes
- 15033 Paulina St
- 15032 Marshfield Ave
- 36 E 151st St
- 15231 Ashland Ave
- 15240 Ashland Ave
- 14911 Page Ave
- 15018 Myrtle Ave
- 110 W 150th St
- 14910 S Wood St
- 14900 Vine Ave
- 15131 Winchester Ave
- 14921 Lincoln Ave
- 15032 Winchester Ave
- 14807 Paulina St
- 15025 Loomis Ave
- 147 W 150th St
- 15311 Winchester Ave
- 98 W 154th St
- 15321 Winchester Ave
- 48 E 154th St
- 32 W 151st St
- 40 W 151st St
- 30 W 151st St
- 15113 Paulina St
- 15115 Paulina St
- 26 W 151st St
- 15108 Paulina St
- 15108 Paulina St
- 15112 Marshfield Ave
- 15119 Paulina St
- 15116 Marshfield Ave
- 44 W 151st St
- 35 W 151st St
- 33 W 151st St
- 37 W 151st St
- 29 W 151st St
- 15118 Marshfield Ave
- 15123 Paulina St
- 25 W 151st St
- 25 W 151st St