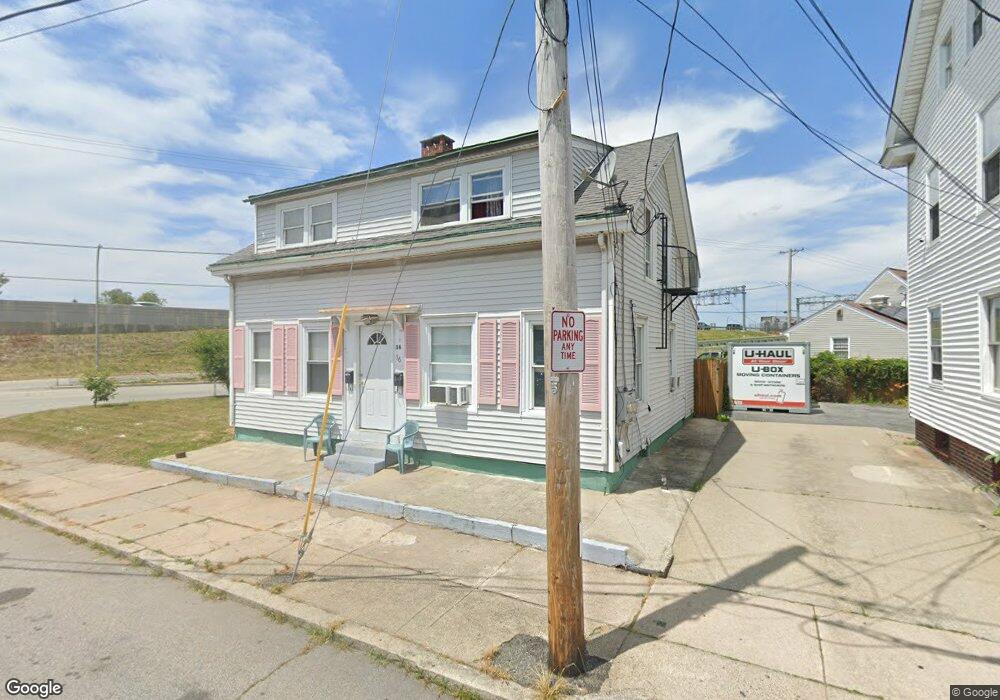
36 W Cole St Pawtucket, RI 02860
Pleasant View NeighborhoodEstimated Value: $298,000 - $470,000
3
Beds
2
Baths
1,560
Sq Ft
$246/Sq Ft
Est. Value
About This Home
This home is located at 36 W Cole St, Pawtucket, RI 02860 and is currently estimated at $383,123, approximately $245 per square foot. 36 W Cole St is a home located in Providence County with nearby schools including Saint Raphael Academy.
Ownership History
Date
Name
Owned For
Owner Type
Purchase Details
Closed on
Jan 28, 2010
Sold by
Alves Luis
Bought by
Alves Luis and Alves Carmen
Current Estimated Value
Purchase Details
Closed on
Sep 25, 2009
Sold by
Reetz Laura and Reetz Keith R
Bought by
Us Bk
Purchase Details
Closed on
Jan 31, 2001
Sold by
Tanis Joseph
Bought by
Reetz Keith R
Purchase Details
Closed on
Dec 2, 1991
Sold by
Hoogasian Gertrude
Bought by
Tavernier Tanis J
Create a Home Valuation Report for This Property
The Home Valuation Report is an in-depth analysis detailing your home's value as well as a comparison with similar homes in the area
Home Values in the Area
Average Home Value in this Area
Purchase History
| Date | Buyer | Sale Price | Title Company |
|---|---|---|---|
| Alves Luis | -- | -- | |
| Alves Luis | $60,000 | -- | |
| Us Bk | $51,038 | -- | |
| Reetz Keith R | $78,000 | -- | |
| Tavernier Tanis J | $55,000 | -- |
Source: Public Records
Mortgage History
| Date | Status | Borrower | Loan Amount |
|---|---|---|---|
| Previous Owner | Tavernier Tanis J | $206,000 | |
| Previous Owner | Tavernier Tanis J | $164,000 | |
| Previous Owner | Tavernier Tanis J | $123,500 |
Source: Public Records
Tax History
| Year | Tax Paid | Tax Assessment Tax Assessment Total Assessment is a certain percentage of the fair market value that is determined by local assessors to be the total taxable value of land and additions on the property. | Land | Improvement |
|---|---|---|---|---|
| 2025 | $3,760 | $285,900 | $107,500 | $178,400 |
| 2024 | $3,528 | $285,900 | $107,500 | $178,400 |
| 2023 | $3,059 | $180,600 | $54,000 | $126,600 |
| 2022 | $2,994 | $180,600 | $54,000 | $126,600 |
| 2021 | $2,994 | $180,600 | $54,000 | $126,600 |
| 2020 | $2,580 | $123,500 | $39,800 | $83,700 |
| 2019 | $2,580 | $123,500 | $39,800 | $83,700 |
| 2018 | $2,486 | $123,500 | $39,800 | $83,700 |
| 2017 | $2,433 | $107,100 | $36,500 | $70,600 |
| 2016 | $2,344 | $107,100 | $36,500 | $70,600 |
| 2015 | $2,344 | $107,100 | $36,500 | $70,600 |
| 2014 | $2,331 | $101,100 | $36,500 | $64,600 |
Source: Public Records
Map
Nearby Homes
- 11 Appleton Ave
- 27 Collins Ave
- 300 Front St Unit 409
- 39 Webster St Unit 204
- 735 Broadway
- 39 John St
- 35 Laurel St
- 511 High St
- 517 High St
- 30 Foundry St Unit 6
- 7 Fales St
- 211 Carnation St
- 54 Sabin St
- 153 Central Ave
- 57 Sylvian St
- 70 Lincoln Ave
- 79 Turner St
- 76 Sylvian St Unit 80
- 48 Kossuth St
- 91 Greenwich St
Your Personal Tour Guide
Ask me questions while you tour the home.