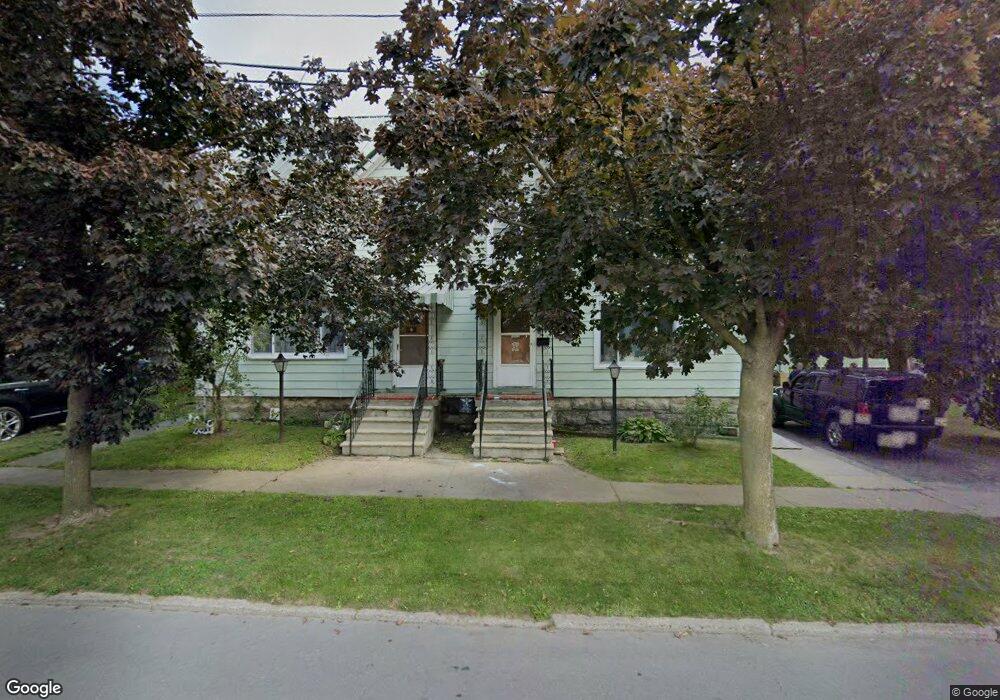
36 Walnut St Unit 38 Seneca Falls, NY 13148
Estimated Value: $159,000 - $181,000
4
Beds
2
Baths
2,340
Sq Ft
$72/Sq Ft
Est. Value
About This Home
This home is located at 36 Walnut St Unit 38, Seneca Falls, NY 13148 and is currently estimated at $169,444, approximately $72 per square foot. 36 Walnut St Unit 38 is a home located in Seneca County with nearby schools including Frank M. Knight Elementary School, Elizabeth Cady Stanton Elementary School, and Seneca Falls Middle School.
Ownership History
Date
Name
Owned For
Owner Type
Purchase Details
Closed on
Mar 15, 2024
Sold by
Lafler Laverne C and Gravite Beth A
Bought by
Frascatore Jacob A
Current Estimated Value
Home Financials for this Owner
Home Financials are based on the most recent Mortgage that was taken out on this home.
Original Mortgage
$122,500
Outstanding Balance
$120,223
Interest Rate
6.63%
Mortgage Type
Purchase Money Mortgage
Estimated Equity
$49,221
Create a Home Valuation Report for This Property
The Home Valuation Report is an in-depth analysis detailing your home's value as well as a comparison with similar homes in the area
Home Values in the Area
Average Home Value in this Area
Purchase History
| Date | Buyer | Sale Price | Title Company |
|---|---|---|---|
| Frascatore Jacob A | $150,000 | None Available | |
| Frascatore Jacob A | $150,000 | None Available |
Source: Public Records
Mortgage History
| Date | Status | Borrower | Loan Amount |
|---|---|---|---|
| Open | Frascatore Jacob A | $122,500 | |
| Closed | Frascatore Jacob A | $122,500 |
Source: Public Records
Tax History
| Year | Tax Paid | Tax Assessment Tax Assessment Total Assessment is a certain percentage of the fair market value that is determined by local assessors to be the total taxable value of land and additions on the property. | Land | Improvement |
|---|---|---|---|---|
| 2024 | $3,873 | $130,000 | $16,900 | $113,100 |
| 2023 | $38 | $130,000 | $16,900 | $113,100 |
| 2022 | $3,536 | $79,400 | $13,000 | $66,400 |
| 2021 | $3,511 | $79,400 | $13,000 | $66,400 |
| 2020 | $1,948 | $79,400 | $13,000 | $66,400 |
| 2019 | $1,347 | $79,400 | $13,000 | $66,400 |
| 2018 | $1,840 | $79,400 | $13,000 | $66,400 |
| 2017 | $1,818 | $79,400 | $13,000 | $66,400 |
| 2016 | $1,421 | $79,400 | $13,000 | $66,400 |
| 2015 | -- | $76,300 | $13,200 | $63,100 |
| 2014 | -- | $76,300 | $13,200 | $63,100 |
Source: Public Records
Map
Nearby Homes
Your Personal Tour Guide
Ask me questions while you tour the home.