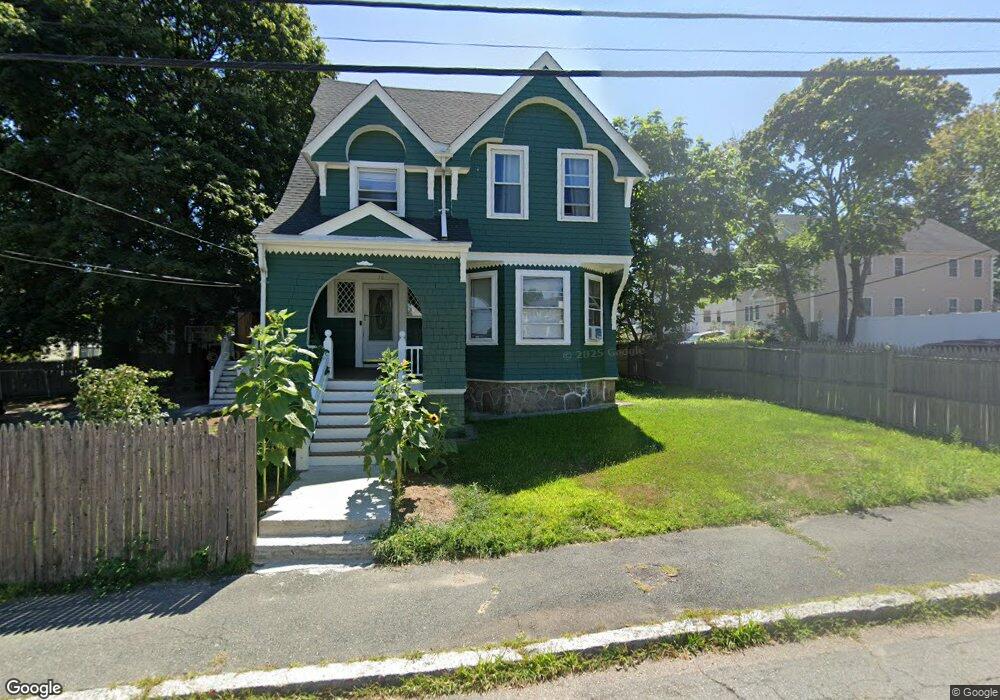
36 Waverly St Unit 1 Brockton, MA 02301
Estimated Value: $581,275 - $632,000
6
Beds
2
Baths
2,100
Sq Ft
$289/Sq Ft
Est. Value
About This Home
This home is located at 36 Waverly St Unit 1, Brockton, MA 02301 and is currently estimated at $606,819, approximately $288 per square foot. 36 Waverly St Unit 1 is a home located in Plymouth County with nearby schools including Louis F Angelo Elementary School, Manthala George Jr. School, and Raymond K-8 Elementary School.
Ownership History
Date
Name
Owned For
Owner Type
Purchase Details
Closed on
Sep 27, 1996
Sold by
Sdb Rt
Bought by
Sildor Wilner and Severino Amada
Current Estimated Value
Purchase Details
Closed on
Apr 1, 1996
Sold by
American First Fcu
Bought by
Sdb Rt
Purchase Details
Closed on
Dec 29, 1995
Sold by
Henderson Neil J and American First Fed Cu
Bought by
American First Fcu
Purchase Details
Closed on
Dec 21, 1987
Sold by
Vega Domingo P
Bought by
Henderson Neal J
Create a Home Valuation Report for This Property
The Home Valuation Report is an in-depth analysis detailing your home's value as well as a comparison with similar homes in the area
Home Values in the Area
Average Home Value in this Area
Purchase History
| Date | Buyer | Sale Price | Title Company |
|---|---|---|---|
| Sildor Wilner | $65,000 | -- | |
| Sdb Rt | $40,000 | -- | |
| American First Fcu | $35,000 | -- | |
| Henderson Neal J | $94,000 | -- |
Source: Public Records
Mortgage History
| Date | Status | Borrower | Loan Amount |
|---|---|---|---|
| Open | Henderson Neal J | $233,000 | |
| Closed | Henderson Neal J | $184,000 | |
| Closed | Henderson Neal J | $122,500 |
Source: Public Records
Tax History Compared to Growth
Tax History
| Year | Tax Paid | Tax Assessment Tax Assessment Total Assessment is a certain percentage of the fair market value that is determined by local assessors to be the total taxable value of land and additions on the property. | Land | Improvement |
|---|---|---|---|---|
| 2025 | $5,505 | $454,600 | $140,400 | $314,200 |
| 2024 | $5,455 | $453,800 | $140,400 | $313,400 |
| 2023 | $5,540 | $426,800 | $105,700 | $321,100 |
| 2022 | $5,010 | $358,600 | $96,100 | $262,500 |
| 2021 | $5,100 | $351,700 | $80,100 | $271,600 |
| 2020 | $4,630 | $305,600 | $74,800 | $230,800 |
| 2019 | $4,354 | $280,200 | $72,800 | $207,400 |
| 2018 | $4,241 | $264,100 | $72,800 | $191,300 |
| 2017 | $4,271 | $265,300 | $72,800 | $192,500 |
| 2016 | $3,885 | $223,800 | $70,700 | $153,100 |
| 2015 | $3,075 | $169,400 | $70,700 | $98,700 |
| 2014 | $3,115 | $171,800 | $70,700 | $101,100 |
Source: Public Records
Map
Nearby Homes
- 12 Charles St
- 0 Prospect St
- 18 Walnut St
- 39 Huntington St
- 56 N Warren Ave
- 260 N Warren Ave Unit A1
- 32 Milton St
- 194 Prospect St
- 401 N Warren Ave
- 34 Eaton St
- 9 Olive Terrace
- 90 Cherry St
- 107 Division St
- 147 Centre St Unit 603
- 147 Centre St Unit 201
- 120 E Ashland St
- 162 Warren Ave
- 37 Hunt St
- 560 N Montello St
- 95 Battles St
- 36 Waverly St
- 33 Falmouth Ave Unit 3
- 33 Falmouth Ave Unit 1
- 33 Falmouth Ave Unit 2
- 33 Falmouth Ave
- 33 Falmouth Ave Unit 5
- 28 Waverly St
- 29 Falmouth Ave Unit 2
- 29 Falmouth Ave
- 29 Falmouth Ave Unit 1
- 27 Falmouth Ave
- 24 Waverly St
- 35 Waverly St
- 29 Waverly St
- 48 Waverly St
- 44 Falmouth Ave
- 18 Waverly St
- 23 Waverly St
- 0 Falmouth Ave
- 30 Falmouth Ave