Estimated Value: $823,655 - $984,000
3
Beds
3
Baths
2,076
Sq Ft
$426/Sq Ft
Est. Value
About This Home
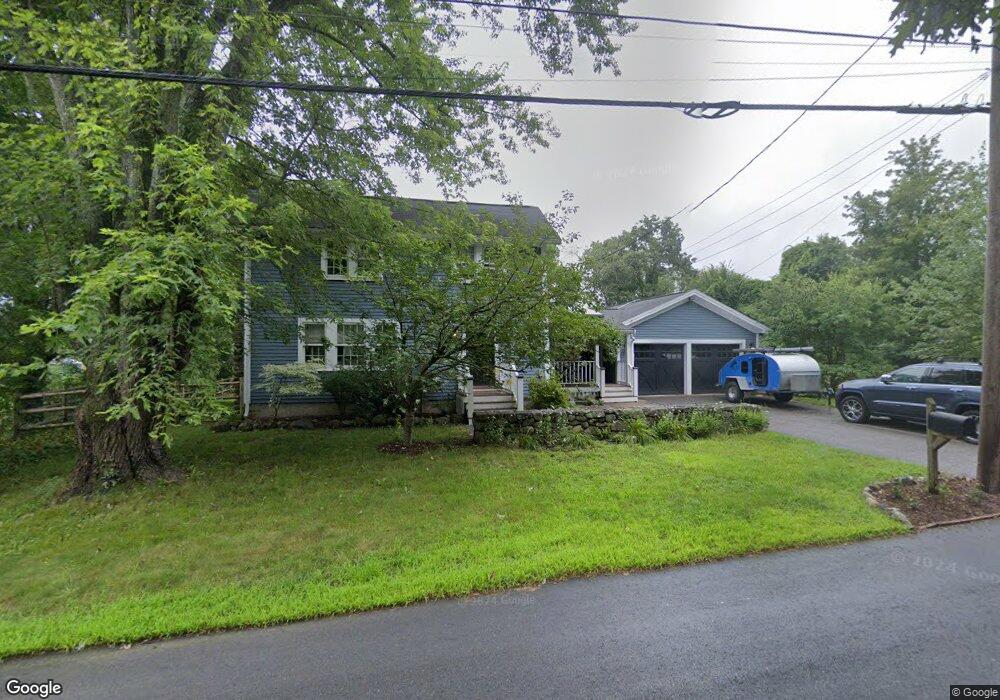
This home is located at 36 Wetherbee St, Acton, MA 01720 and is currently estimated at $884,914, approximately $426 per square foot. 36 Wetherbee St is a home located in Middlesex County with nearby schools including Acton-Boxborough Regional High School, Nashoba Brooks School, and Concord Academy.
Ownership History
Date
Name
Owned For
Owner Type
Purchase Details
Closed on
Jan 6, 2014
Sold by
Peterson Erik A and Peterson Kirsten J
Bought by
Peterson Kirsten J and Peterson Erik A
Current Estimated Value
Home Financials for this Owner
Home Financials are based on the most recent Mortgage that was taken out on this home.
Original Mortgage
$375,000
Outstanding Balance
$281,466
Interest Rate
4.24%
Mortgage Type
New Conventional
Estimated Equity
$603,448
Purchase Details
Closed on
Jun 22, 2000
Sold by
Amidon Mark L and Amidon Tamar E
Bought by
Peterson Erik A and Johnson Kirsten M
Purchase Details
Closed on
Jul 21, 1993
Sold by
Vanaria Orlando and Vanaria Lillian
Bought by
Amidon Tamar E and Amidon Mark
Create a Home Valuation Report for This Property
The Home Valuation Report is an in-depth analysis detailing your home's value as well as a comparison with similar homes in the area
Home Values in the Area
Average Home Value in this Area
Purchase History
| Date | Buyer | Sale Price | Title Company |
|---|---|---|---|
| Peterson Kirsten J | -- | -- | |
| Peterson Erik A | $309,000 | -- | |
| Amidon Tamar E | $165,000 | -- |
Source: Public Records
Mortgage History
| Date | Status | Borrower | Loan Amount |
|---|---|---|---|
| Open | Amidon Tamar E | $375,000 | |
| Previous Owner | Amidon Tamar E | $315,000 |
Source: Public Records
Tax History
| Year | Tax Paid | Tax Assessment Tax Assessment Total Assessment is a certain percentage of the fair market value that is determined by local assessors to be the total taxable value of land and additions on the property. | Land | Improvement |
|---|---|---|---|---|
| 2025 | $13,051 | $761,000 | $282,300 | $478,700 |
| 2024 | $12,177 | $730,500 | $282,300 | $448,200 |
| 2023 | $11,879 | $676,500 | $256,500 | $420,000 |
| 2022 | $11,230 | $577,400 | $223,100 | $354,300 |
| 2021 | $10,967 | $542,100 | $206,500 | $335,600 |
| 2020 | $10,340 | $537,400 | $206,500 | $330,900 |
| 2019 | $9,784 | $505,100 | $206,500 | $298,600 |
| 2018 | $9,448 | $487,500 | $206,500 | $281,000 |
| 2017 | $9,204 | $482,900 | $206,500 | $276,400 |
| 2016 | $9,023 | $469,200 | $206,500 | $262,700 |
| 2015 | $9,026 | $473,800 | $206,500 | $267,300 |
| 2014 | $8,710 | $447,800 | $206,500 | $241,300 |
Source: Public Records
Map
Nearby Homes
- 1 Bayberry Rd
- 303 School St
- 60 Lawsbrook Rd
- 187 Great Rd Unit A1
- 42 Sunnyside Ln
- 65 Summit St
- 134 Pope Rd
- 27 Forest Rd
- 79-81 Assabet Ave
- 56 Isaac Davis Rd
- 66 Old Stow Rd
- 54 Maple St
- 95 Conant St Unit 320
- 104 Channing Rd
- 491 Main St
- 19 Whippoorwill Ln
- 37 Water St
- 27 Water St
- 1687 Main St
- 46 Taylor Rd
- 40 Wetherbee St
- 32 Wetherbee St
- 33 Wetherbee St
- 18 Wetherbee St
- 21 Wetherbee St
- 48 Great Rd Unit 11
- 48 Great Rd Unit 38
- 48 Great Rd Unit 37
- 48 Great Rd Unit 36
- 48 Great Rd Unit 35
- 48 Great Rd Unit 34
- 48 Great Rd Unit 33
- 48 Great Rd Unit 32
- 48 Great Rd Unit 31
- 48 Great Rd Unit 28
- 48 Great Rd Unit 27
- 48 Great Rd Unit 26
- 48 Great Rd Unit 25
- 48 Great Rd Unit 24
- 48 Great Rd Unit 23