P
Landlord's Agent in 2025
Patricia Costa
Avenue Realty NJ
(347) 449-8790
12 Total Sales


Estimated Value: $661,000 - $758,000
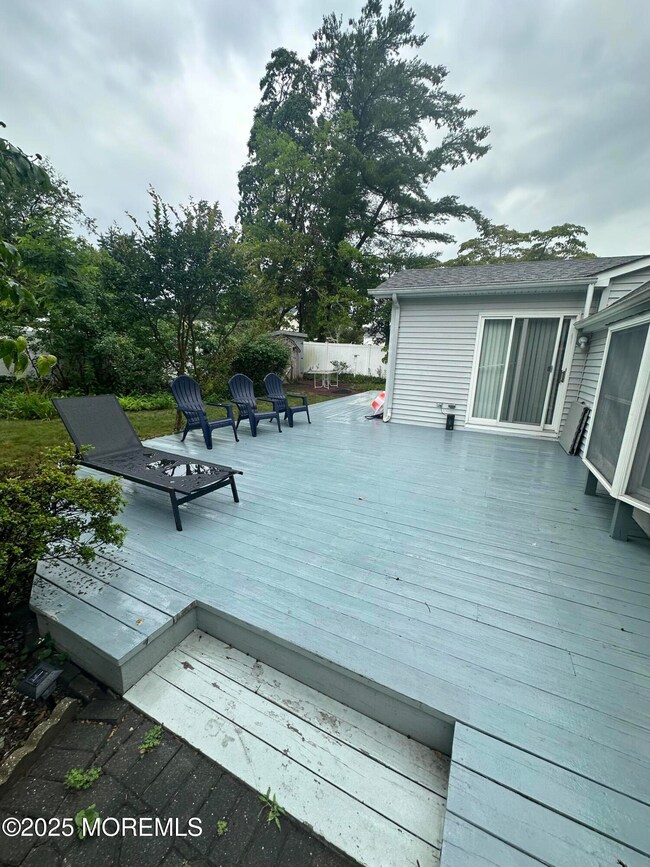
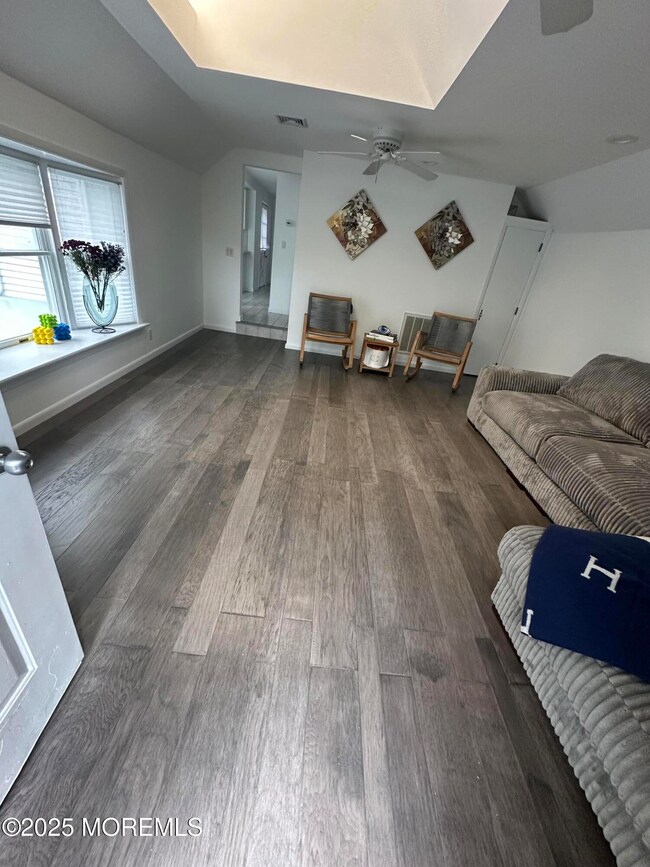
Charming and impeccably maintained back house on a shared lot, featuring 2 spacious bedrooms and 1 full bathroom. Enjoy relaxing mornings and evenings on the inviting deck. House offers washer and dryer and its fully furnished.
Winter rental
Last Agent to Rent the Property
Avenue Realty NJ License #2295867 Listed on: 11/29/2025
| Date | Buyer | Sale Price | Title Company |
|---|---|---|---|
| Madar Eli | $710,000 | Old Republic National Title In | |
| Madar Eli | $710,000 | Old Republic National Title In | |
| Leach Gloria B | -- | None Available |
| Date | Event | Price | List to Sale | Price per Sq Ft |
|---|---|---|---|---|
| 12/01/2025 12/01/25 | Rented | $19,800 | +800.0% | -- |
| 11/29/2025 11/29/25 | For Rent | $2,200 | -- | -- |
| Year | Tax Paid | Tax Assessment Tax Assessment Total Assessment is a certain percentage of the fair market value that is determined by local assessors to be the total taxable value of land and additions on the property. | Land | Improvement |
|---|---|---|---|---|
| 2025 | $8,687 | $644,400 | $433,800 | $210,600 |
| 2024 | $12,270 | $609,200 | $403,400 | $205,800 |
| 2023 | $12,270 | $802,500 | $603,300 | $199,200 |
| 2022 | $8,298 | $515,600 | $325,900 | $189,700 |
| 2021 | $8,298 | $422,300 | $252,200 | $170,100 |
| 2020 | $8,332 | $418,500 | $252,200 | $166,300 |
| 2019 | $8,174 | $400,900 | $235,600 | $165,300 |
| 2018 | $7,122 | $340,100 | $183,400 | $156,700 |
| 2017 | $7,171 | $341,000 | $192,900 | $148,100 |
| 2016 | $6,327 | $270,600 | $164,400 | $106,200 |
| 2015 | $6,625 | $286,900 | $183,400 | $103,500 |
| 2014 | $6,622 | $290,700 | $183,400 | $107,300 |
P
Landlord's Agent in 2025
Patricia Costa
Avenue Realty NJ
(347) 449-8790
12 Total Sales
Source: MOREMLS (Monmouth Ocean Regional REALTORS®)
MLS Number: 22535586
APN: 37-00004-0000-00005
Disclaimer: Certain information contained herein is derived from information provided by parties other than Homes.com. All information provided is deemed reliable, but is not guaranteed to be accurate and should be independently verified.
![]() IDX information is provided exclusively for personal, non-commercial use, and may not be used for any purpose other than to identify prospective properties consumers may be interested in purchasing.
IDX information is provided exclusively for personal, non-commercial use, and may not be used for any purpose other than to identify prospective properties consumers may be interested in purchasing.
Information is deemed reliable but not guaranteed.
