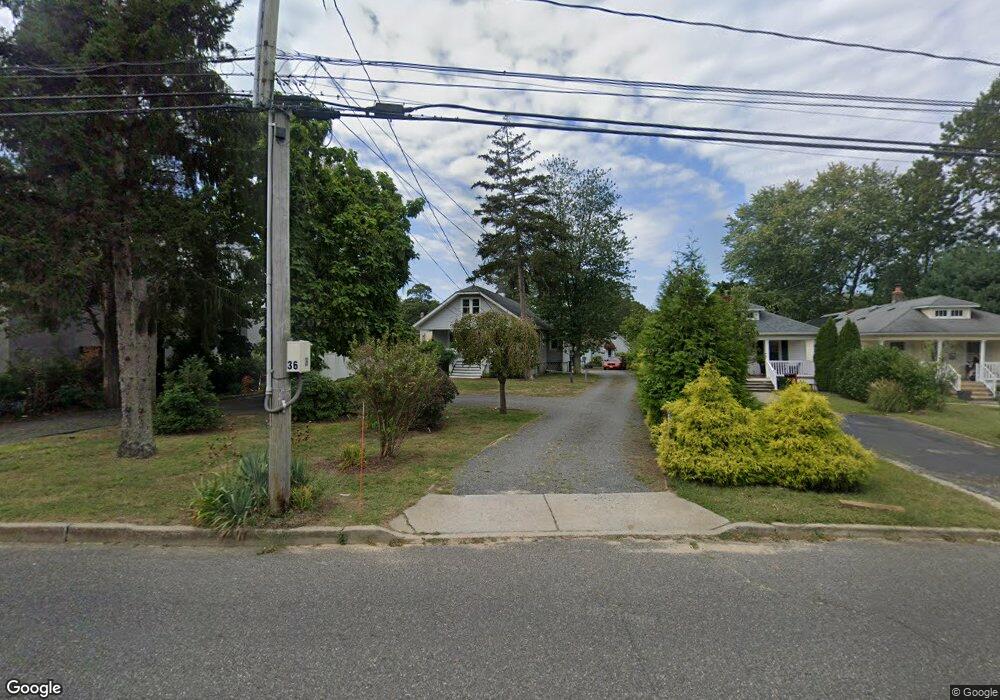
36 Whalepond Rd Oakhurst, NJ 07755
Estimated Value: $703,000 - $753,000
1
Bed
1
Bath
858
Sq Ft
$841/Sq Ft
Est. Value
About This Home
This home is located at 36 Whalepond Rd, Oakhurst, NJ 07755 and is currently estimated at $721,515, approximately $840 per square foot. 36 Whalepond Rd is a home located in Monmouth County with nearby schools including Ocean Township High School, Bet Yaakov of the Jersey Shore, and Bnot Shirah of Deal.
Ownership History
Date
Name
Owned For
Owner Type
Purchase Details
Closed on
Jan 23, 2025
Sold by
Revocable Living Trust Of Gloria B Leach and Dahrouge Gloria B
Bought by
Madar Eli and Madar Galit
Current Estimated Value
Purchase Details
Closed on
Oct 25, 2021
Sold by
Leach Gloria B
Bought by
Leach Gloria B and Revocable Living Trust Of Glor
Create a Home Valuation Report for This Property
The Home Valuation Report is an in-depth analysis detailing your home's value as well as a comparison with similar homes in the area
Home Values in the Area
Average Home Value in this Area
Purchase History
| Date | Buyer | Sale Price | Title Company |
|---|---|---|---|
| Madar Eli | $710,000 | Old Republic National Title In | |
| Madar Eli | $710,000 | Old Republic National Title In | |
| Leach Gloria B | -- | None Available |
Source: Public Records
Tax History
| Year | Tax Paid | Tax Assessment Tax Assessment Total Assessment is a certain percentage of the fair market value that is determined by local assessors to be the total taxable value of land and additions on the property. | Land | Improvement |
|---|---|---|---|---|
| 2025 | $8,687 | $644,400 | $433,800 | $210,600 |
| 2024 | $12,270 | $609,200 | $403,400 | $205,800 |
| 2023 | $12,270 | $802,500 | $603,300 | $199,200 |
| 2022 | $8,298 | $515,600 | $325,900 | $189,700 |
| 2021 | $8,298 | $422,300 | $252,200 | $170,100 |
| 2020 | $8,332 | $418,500 | $252,200 | $166,300 |
| 2019 | $8,174 | $400,900 | $235,600 | $165,300 |
| 2018 | $7,122 | $340,100 | $183,400 | $156,700 |
| 2017 | $7,171 | $341,000 | $192,900 | $148,100 |
| 2016 | $6,327 | $270,600 | $164,400 | $106,200 |
| 2015 | $6,625 | $286,900 | $183,400 | $103,500 |
| 2014 | $6,622 | $290,700 | $183,400 | $107,300 |
Source: Public Records
Map
Nearby Homes
- 36 Whalepond Rd Unit rear
- 36 Whalepond Rd Unit front
- 36 Whalepond Rd Unit R
- 32 Whalepond Rd
- 40 Whalepond Rd
- 8 Brooke St
- 6 Brooke St
- 42 Whalepond Rd
- 43 Heath Ave
- 2 Carole Dr
- 35 Whalepond Rd
- 41 Heath Ave
- 45 Heath Ave
- 47 Heath Ave
- 1 Carole Dr
- 7 Whalepond Rd
- 7 Brooke St
- 44 Whalepond Rd
- 39 Heath Ave
- 424 W Lake Ave
Your Personal Tour Guide
Ask me questions while you tour the home.