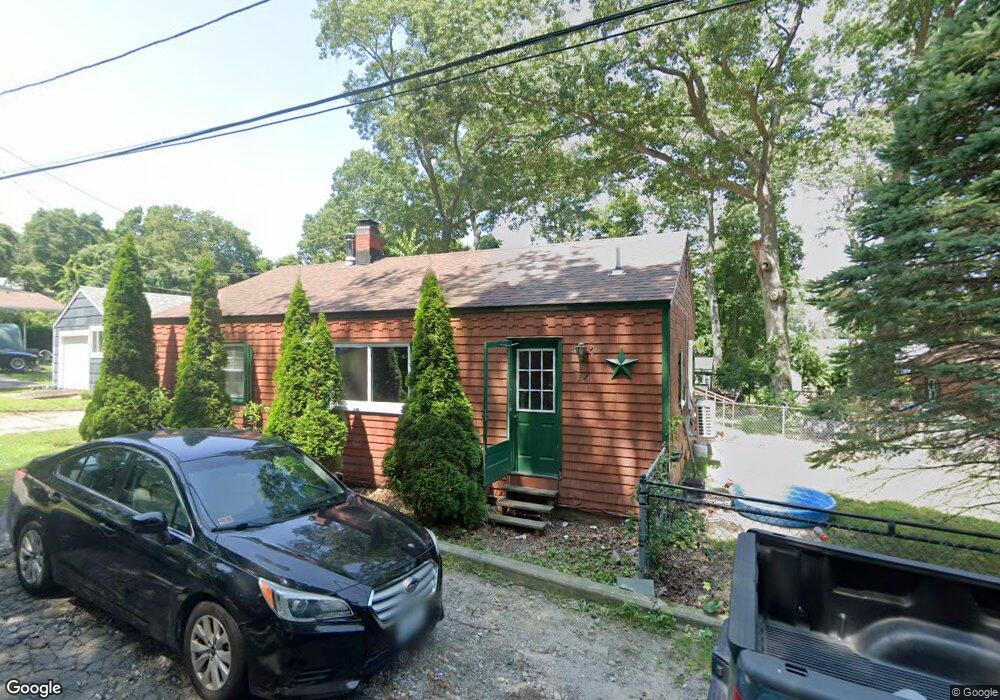
36 Willow St Tiverton, RI 02878
Eagleville NeighborhoodEstimated Value: $306,000 - $381,000
2
Beds
1
Bath
864
Sq Ft
$403/Sq Ft
Est. Value
About This Home
This home is located at 36 Willow St, Tiverton, RI 02878 and is currently estimated at $348,566, approximately $403 per square foot. 36 Willow St is a home located in Newport County with nearby schools including Tiverton High School, Atlantis Charter School, and Argosy Collegiate Charter School.
Ownership History
Date
Name
Owned For
Owner Type
Purchase Details
Closed on
Dec 18, 2020
Sold by
Gendreau Ronald V
Bought by
Gendreau Matthew S
Current Estimated Value
Purchase Details
Closed on
Dec 27, 2001
Sold by
Menard Michael L
Bought by
Gendreau Ronald V
Purchase Details
Closed on
Aug 28, 1998
Sold by
Gadino Jacob and Gadino Pauline
Bought by
Menard Michael L
Purchase Details
Closed on
May 22, 1989
Sold by
Gadino Jacob
Bought by
Pires Joseph
Create a Home Valuation Report for This Property
The Home Valuation Report is an in-depth analysis detailing your home's value as well as a comparison with similar homes in the area
Home Values in the Area
Average Home Value in this Area
Purchase History
| Date | Buyer | Sale Price | Title Company |
|---|---|---|---|
| Gendreau Matthew S | $175,000 | None Available | |
| Gendreau Ronald V | $107,600 | -- | |
| Menard Michael L | $80,000 | -- | |
| Pires Joseph | $90,000 | -- |
Source: Public Records
Mortgage History
| Date | Status | Borrower | Loan Amount |
|---|---|---|---|
| Previous Owner | Pires Joseph | $108,624 | |
| Previous Owner | Pires Joseph | $15,000 | |
| Previous Owner | Pires Joseph | $129,000 |
Source: Public Records
Tax History
| Year | Tax Paid | Tax Assessment Tax Assessment Total Assessment is a certain percentage of the fair market value that is determined by local assessors to be the total taxable value of land and additions on the property. | Land | Improvement |
|---|---|---|---|---|
| 2025 | $2,893 | $261,800 | $91,600 | $170,200 |
| 2024 | $2,893 | $261,800 | $91,600 | $170,200 |
| 2023 | $2,570 | $172,500 | $91,200 | $81,300 |
| 2022 | $2,524 | $172,500 | $91,200 | $81,300 |
| 2021 | $2,462 | $172,500 | $91,200 | $81,300 |
| 2020 | $2,354 | $145,400 | $75,400 | $70,000 |
| 2019 | $2,296 | $145,400 | $75,400 | $70,000 |
| 2018 | $2,383 | $145,400 | $75,400 | $70,000 |
| 2017 | $2,646 | $138,900 | $72,900 | $66,000 |
| 2016 | $2,504 | $130,800 | $72,900 | $57,900 |
| 2015 | $2,504 | $130,800 | $72,900 | $57,900 |
| 2014 | $2,559 | $132,600 | $70,000 | $62,600 |
Source: Public Records
Map
Nearby Homes
- 1082 Hancock St
- 37 Bluejay St
- 206 Songbird Ln
- 84 Lark Ln
- 71 Blackbird St
- 664 Norman St
- 3 Blackbird St
- 0 Wood St
- 0 Hancock St
- 18 Mockingbird Ln
- 38 Hummingbird Ln
- 21 Nightingale Ln
- 0 Sheldon St
- 185 Stafford Rd
- 0 Stafford Rd Unit 1393774
- 85 Watuppa Rd
- 186 Spencer St
- 100 Corys Ln
- 447 Stafford Rd Unit E7
- 11 Harrison Ct
Your Personal Tour Guide
Ask me questions while you tour the home.