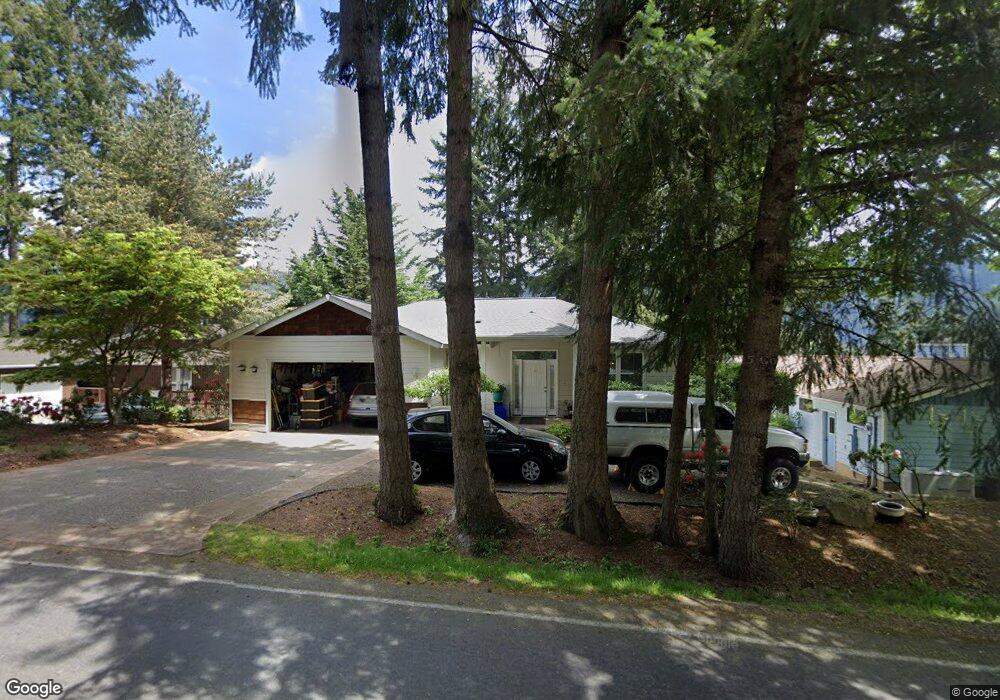
36 Windward Dr Bellingham, WA 98229
Estimated Value: $682,000 - $787,000
3
Beds
3
Baths
1,203
Sq Ft
$591/Sq Ft
Est. Value
About This Home
This home is located at 36 Windward Dr, Bellingham, WA 98229 and is currently estimated at $711,274, approximately $591 per square foot. 36 Windward Dr is a home located in Whatcom County with nearby schools including Geneva Elementary School, Kulshan Middle School, and Bellingham High School.
Ownership History
Date
Name
Owned For
Owner Type
Purchase Details
Closed on
Jul 31, 2006
Sold by
Riley Grant S
Bought by
Ericksen Charles A and Ericksen Jolene A
Current Estimated Value
Home Financials for this Owner
Home Financials are based on the most recent Mortgage that was taken out on this home.
Original Mortgage
$304,000
Outstanding Balance
$178,006
Interest Rate
6.69%
Mortgage Type
Purchase Money Mortgage
Estimated Equity
$533,268
Purchase Details
Closed on
Feb 23, 2005
Sold by
Michael Paul and Michael Roxanne M
Bought by
Riley Grant S
Home Financials for this Owner
Home Financials are based on the most recent Mortgage that was taken out on this home.
Original Mortgage
$150,000
Interest Rate
5.66%
Mortgage Type
Purchase Money Mortgage
Purchase Details
Closed on
Oct 14, 2003
Sold by
Village William W and Village Margaret Lee
Bought by
Michael Paul
Create a Home Valuation Report for This Property
The Home Valuation Report is an in-depth analysis detailing your home's value as well as a comparison with similar homes in the area
Home Values in the Area
Average Home Value in this Area
Purchase History
| Date | Buyer | Sale Price | Title Company |
|---|---|---|---|
| Ericksen Charles A | $380,280 | Stewart Title Company | |
| Riley Grant S | $329,900 | Stewart Title Company | |
| Michael Paul | -- | Whatcom Land Title |
Source: Public Records
Mortgage History
| Date | Status | Borrower | Loan Amount |
|---|---|---|---|
| Open | Ericksen Charles A | $304,000 | |
| Previous Owner | Riley Grant S | $150,000 |
Source: Public Records
Tax History
| Year | Tax Paid | Tax Assessment Tax Assessment Total Assessment is a certain percentage of the fair market value that is determined by local assessors to be the total taxable value of land and additions on the property. | Land | Improvement |
|---|---|---|---|---|
| 2025 | $5,813 | $642,313 | $242,649 | $399,664 |
| 2024 | $5,635 | $632,808 | $239,058 | $393,750 |
| 2023 | $5,635 | $655,107 | $247,482 | $407,625 |
| 2022 | $4,205 | $532,605 | $201,204 | $331,401 |
| 2021 | $3,964 | $385,946 | $145,800 | $240,146 |
| 2020 | $4,143 | $357,357 | $135,000 | $222,357 |
| 2019 | $3,657 | $369,438 | $128,700 | $240,738 |
| 2018 | $3,694 | $333,269 | $116,100 | $217,169 |
| 2017 | $3,351 | $286,766 | $99,900 | $186,866 |
| 2016 | $3,063 | $271,265 | $94,500 | $176,765 |
| 2015 | $3,141 | $259,640 | $90,450 | $169,190 |
| 2014 | -- | $258,348 | $90,000 | $168,348 |
| 2013 | -- | $248,602 | $87,600 | $161,002 |
Source: Public Records
Map
Nearby Homes
- 61 Windward Dr
- 434 Sudden Valley Dr
- 1 Morning Beach Dr Unit 5
- 18 Inglewood Place
- 22 Marigold Dr Unit 34
- 22 Marigold Dr Unit 45
- 2 Marigold Dr Unit 38
- 2 Marigold Dr Unit 40
- 2 Marigold Dr Unit 36
- 1 Lake Louise Dr Unit 42
- 41 Marigold Dr
- 10 Sandalwood Cir
- 8 Valley View Cir
- 33 Green Hill Rd
- 28 Grand View Ln
- 55 Green Hill Rd
- 329 Sudden Valley Dr
- 124 Sudden Valley Dr
- 15 Wintercress Way
- 14 Black Bear Ct Unit A
Your Personal Tour Guide
Ask me questions while you tour the home.