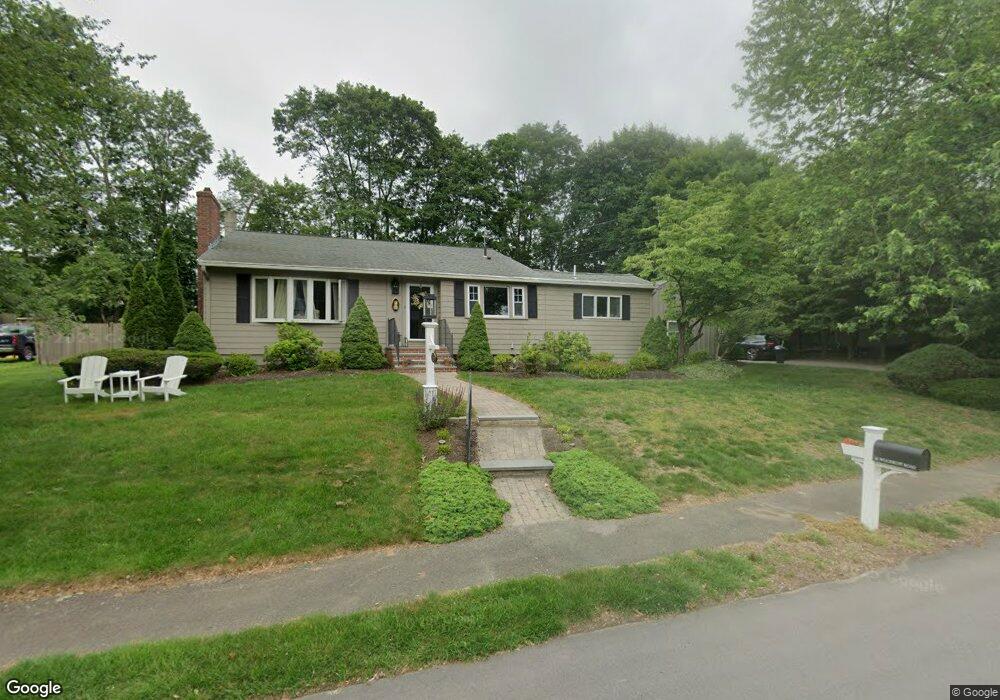
36 Woodruff Rd Walpole, MA 02081
Estimated Value: $752,000 - $887,000
3
Beds
2
Baths
2,100
Sq Ft
$377/Sq Ft
Est. Value
About This Home
This home is located at 36 Woodruff Rd, Walpole, MA 02081 and is currently estimated at $792,333, approximately $377 per square foot. 36 Woodruff Rd is a home located in Norfolk County with nearby schools including Fisher School, Walpole Middle School, and Walpole High School.
Ownership History
Date
Name
Owned For
Owner Type
Purchase Details
Closed on
May 17, 2016
Sold by
Sullivan Barbara L
Bought by
Farrell Kara
Current Estimated Value
Home Financials for this Owner
Home Financials are based on the most recent Mortgage that was taken out on this home.
Original Mortgage
$414,400
Outstanding Balance
$326,858
Interest Rate
3.71%
Mortgage Type
New Conventional
Estimated Equity
$465,475
Purchase Details
Closed on
Jul 31, 2012
Sold by
Mahan Scott E and Mahan Suzanne L
Bought by
Sullivan Barbara L
Purchase Details
Closed on
Oct 13, 2006
Sold by
Mcinerney Carrie E and Mcinerney John
Bought by
Mahan Scott E and Mahan Suzanne L
Home Financials for this Owner
Home Financials are based on the most recent Mortgage that was taken out on this home.
Original Mortgage
$380,000
Interest Rate
6.47%
Mortgage Type
Purchase Money Mortgage
Purchase Details
Closed on
Nov 30, 2001
Sold by
Shea Michael T and Shea Michelle C
Bought by
Mcinerney John and Mcinerney Carrie E
Purchase Details
Closed on
Nov 26, 1997
Sold by
Roidoulis Paul
Bought by
Shea Michael T and Shea Michelle C
Purchase Details
Closed on
Dec 1, 1989
Sold by
Procaccini Mark J
Bought by
Roidoulis Paul A
Create a Home Valuation Report for This Property
The Home Valuation Report is an in-depth analysis detailing your home's value as well as a comparison with similar homes in the area
Home Values in the Area
Average Home Value in this Area
Purchase History
| Date | Buyer | Sale Price | Title Company |
|---|---|---|---|
| Farrell Kara | $518,000 | -- | |
| Sullivan Barbara L | $370,000 | -- | |
| Mahan Scott E | $476,667 | -- | |
| Mcinerney John | $350,000 | -- | |
| Shea Michael T | $213,000 | -- | |
| Roidoulis Paul A | $215,000 | -- |
Source: Public Records
Mortgage History
| Date | Status | Borrower | Loan Amount |
|---|---|---|---|
| Open | Farrell Kara | $414,400 | |
| Previous Owner | Roidoulis Paul A | $378,800 | |
| Previous Owner | Mahan Scott E | $380,000 | |
| Previous Owner | Roidoulis Paul A | $295,000 |
Source: Public Records
Tax History
| Year | Tax Paid | Tax Assessment Tax Assessment Total Assessment is a certain percentage of the fair market value that is determined by local assessors to be the total taxable value of land and additions on the property. | Land | Improvement |
|---|---|---|---|---|
| 2025 | $8,368 | $652,200 | $354,500 | $297,700 |
| 2024 | $8,084 | $611,500 | $340,800 | $270,700 |
| 2023 | $7,738 | $557,100 | $296,400 | $260,700 |
| 2022 | $7,312 | $505,700 | $274,500 | $231,200 |
| 2021 | $7,034 | $474,000 | $258,900 | $215,100 |
| 2020 | $6,892 | $459,800 | $244,200 | $215,600 |
| 2019 | $6,649 | $440,300 | $234,900 | $205,400 |
| 2018 | $6,410 | $419,800 | $226,600 | $193,200 |
| 2017 | $6,196 | $404,200 | $218,000 | $186,200 |
| 2016 | $6,031 | $387,600 | $209,800 | $177,800 |
| 2015 | $5,800 | $369,400 | $199,900 | $169,500 |
| 2014 | $5,466 | $346,800 | $199,900 | $146,900 |
Source: Public Records
Map
Nearby Homes
- 8 Mckinley Ave
- 38 Garden Pkwy
- 291 Plimpton St
- 7 Tilton Ct Unit Ct
- 26 Albemarle Rd
- 40 Endean Dr
- 5 Endicott St Unit 3
- 19 and 23 Arlington Ln
- 65 Alandale Pkwy
- 70 Endicott St Unit 401
- 74 Alandale Pkwy
- 56 North St
- 26 Dover Dr
- 363 - 367 Washington St
- 53 Tremont St
- 31 Downing St
- 14 Wood Dr
- 120 Polley Ln
- 0 Charlotte Rd
- 2 Kendall St
Your Personal Tour Guide
Ask me questions while you tour the home.